Regular daily update on BTC ta analysts opinions.

**My summary - short-term sentiment: bearish ** (last: bearish)

- We recovered to the 50 MA daily at around 8'348.
- @Haejin sees us more likely to go up from here. @lordoftruth sees 7'925 be the swing low and we go up.
- All other analysts expect that we are going down further.
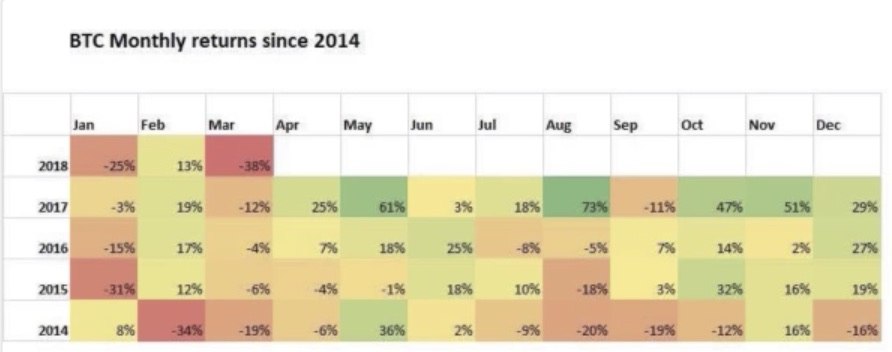
- May is usually a strong month. Lets see how it plays out in 2018.
News about the blog
I need to revise my 2018 long term table. I need to add a 2018 and 2019 target an be more precise on the sentiment here. Will do that after I am back in Switzerland.
We lunched the bounty project beta. If you are interested and you like to create a bounty on your own have a look at this post
Analysts key statements:
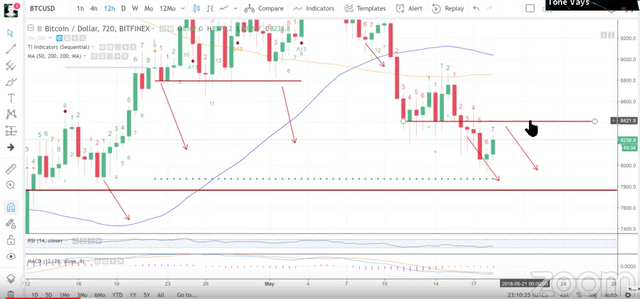
Tone:
- Weekly: Looks very similar to 2014 - we have not been able to get back up over the MA 30.
- Daily: Has a decent day but still below MA 7 and 30.
- 12h: He expects bounce to 8'400 and than accelerating to the downside.
@haejin:
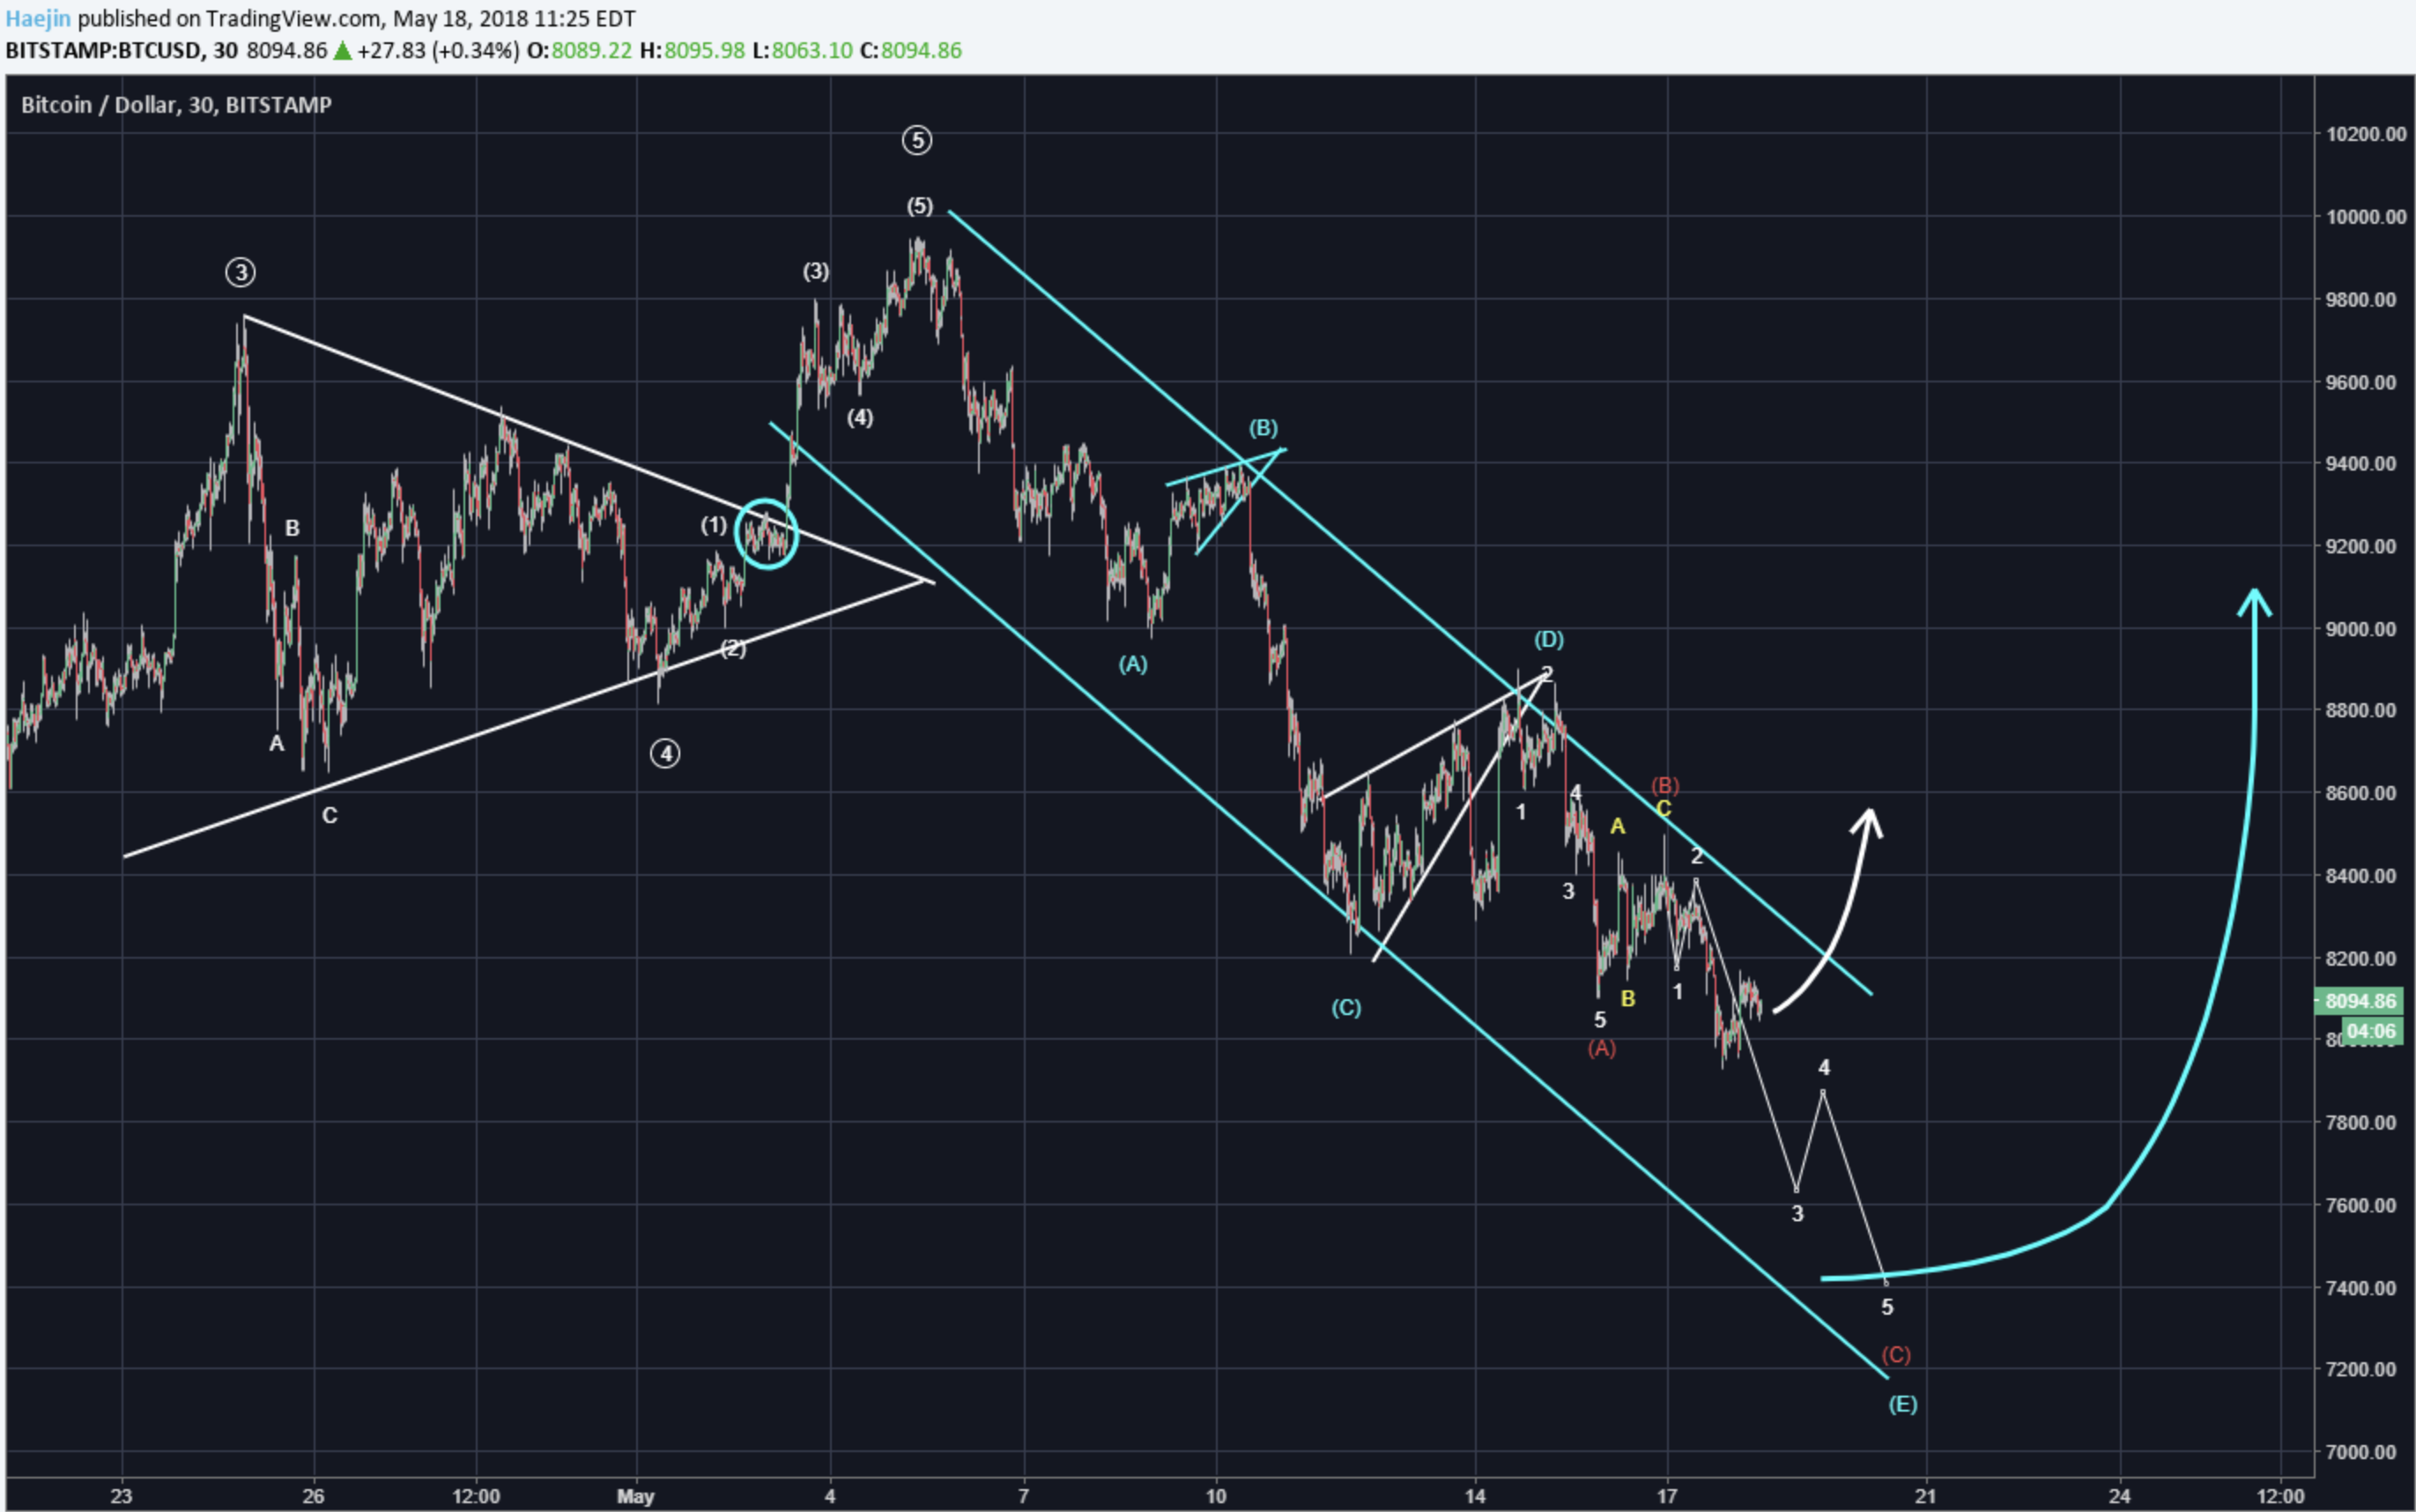
Bitcoin price declined to a lower low as shown in the below chart. White wave 3 is still in progress. Therefore, completion of the five subwaves of C of E could likely bring prices down to the 7'200 or so zone.
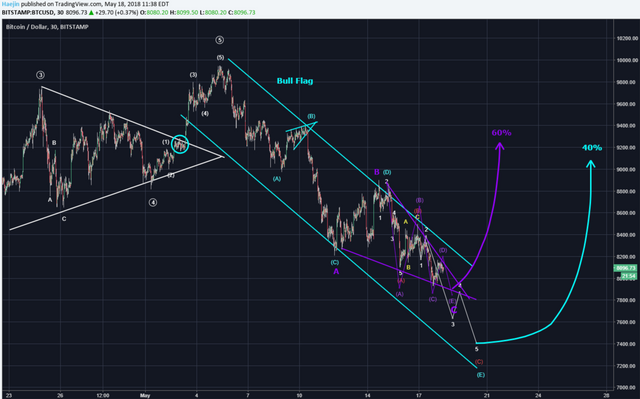
Alternate: Pattern of a bull flag because it's downward pointing. Within this is a potential downward pointing, bullish, wedge pattern (purple). The abcde (purple) show that only e wave remains to complete the wedge pattern and price can certainly breakout from this level. Wave e should be at around 7'875. He gives it a 60% preference for the wedge breakout and a 40% chance for the price to actually decline to 7'200.
@ew-and-patterns:

Finally BTC has shown what the correction will look like. There are two ways to label this, but the result is absolutely 100% the same, so it doesn't matter much. It is either ABCDE or just ABC as a 3-3-5 flat correction.
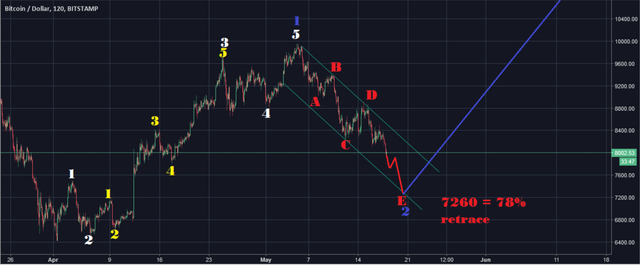
Now the target will likely be 7'260 (78% correction target for a wave 2).
At this point, there is a very high chance of an amazing rally starting off the bottom. BTC might rise 1'000 in only 1 hour. That's when you know that the correction is over. That is the point in time that institutional investors have been waiting for months now. The time for FOMO will be soon.
@lordoftruth:
Bitcoin price is most likely ready for a rally at this stage, and downside risk is limited.
He sees bitcoin price hold at 7'925 and most likely the bull is the winner.
Todays trend is slightly bullish. Trading between 7'614 and 8'643.
@philakonesteemit:
On the Bullish side, a break above 8'500 will validate his count to a 8'900. A Break above 8'900 will confirm his 13'500+ target.
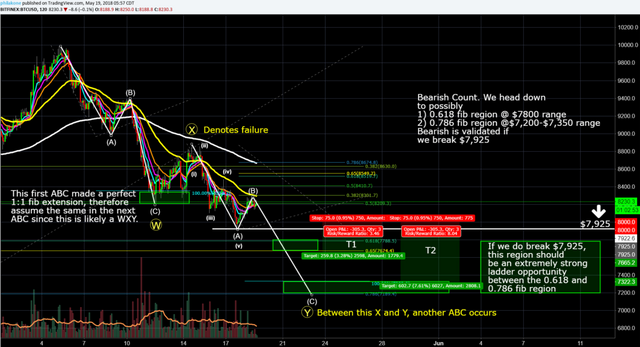
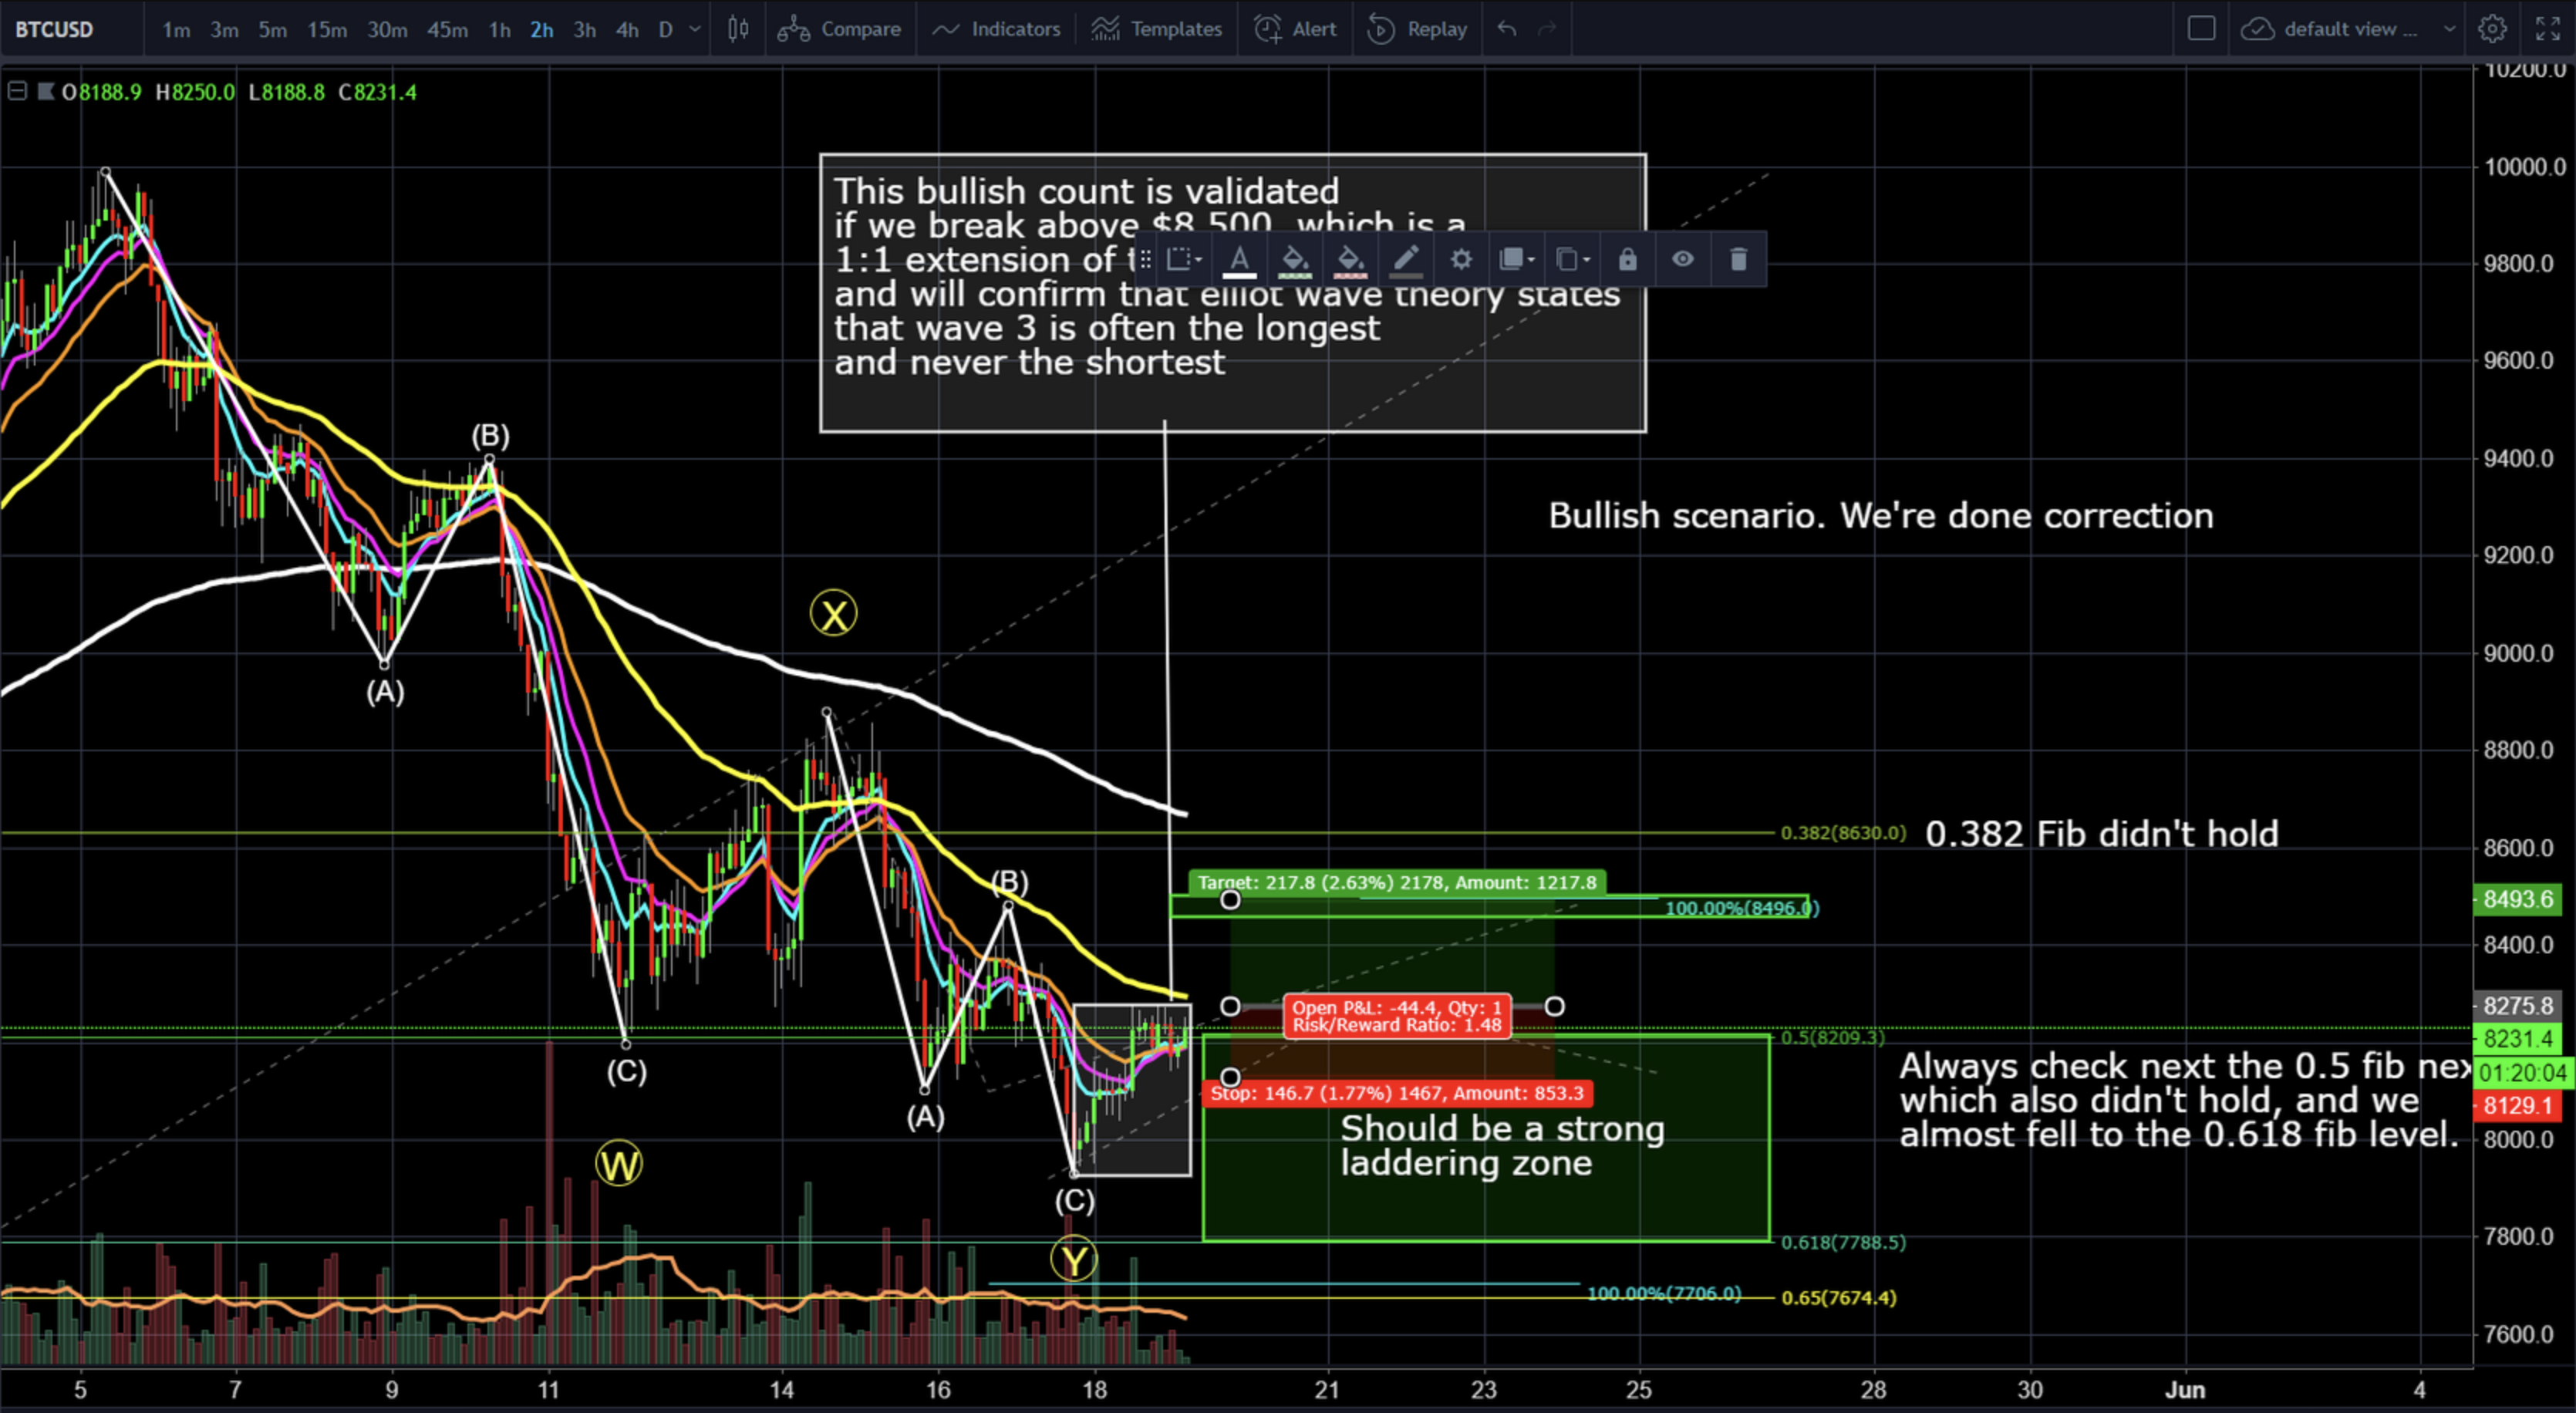 On the bearish side, he can see btc dropping to 0.618 fib level at 7'800 range first. If that doesn't hold next level is 7'300 range.
@passion-ground:

Although (basis the 4-hour chart) a bearish 5-wave impulsive decline off the recent 9'848 print high has manifested.From the current pullback low of 8'100, the 9'243 level (a .618 retracement thereof) becomes critical to observe.
If BTC is able to bullishly rally and “sustain” trade above 9'243 from here, it would then become highly likely that 8'100 would mark an interim low, and that we are on our way to riding a bullish 3rd wave up at the minute degree of trend.
If we get rejected instead would increase the likely hood of reaching the noted downside target of 7,966, or possibly lower before we mark the preferred bullish minute 2-wave down.
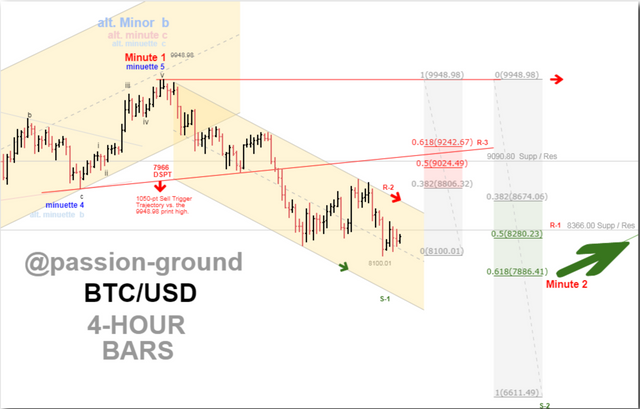
Summary of targets/support/resistance


Reference table
| analyst | latest content date | link to content for details |
|---|---|---|
| Tone Vays | 18. May | here |
| @haejin | 18. May | here |
| @ew-and-patterns | 18. May | here |
| @lordoftruth | 18. May | here |
| @philakonesteemit | 18. May | here |
| @passion-ground | 17. May | here |
Definition
- light blue highlighted = all content that changed since last update.
- sentiment = how in general the analysts see the current situation (bearish = lower prices more likely / bullish = higher prices more likely)
- target = the next (short term) price target an analysts mentions. This might be next day or in a few days. It might be that an analyst is bullish but sees a short term pull-back so giving nevertheless a lower (short term) target.
- support/res(istance) = Most significant support or resistances mentioned by the analysts. If those are breached a significant move to the upside or downside is expected.
- bottom = -> now renamed and moved to long term table. Low 2018
- low/top 2018 = what is the low or the top expected for 2018?
Further links for educational purposes:
- From @ToneVays: Learning trading
- From @philakonecrypto: Like in every post you find links to his amazing educational videos. For example here
- From @lordoftruth: Fibonacci Retracement
- From @haejin: Elliott Wave Counting Tutorial
*If you like me to add other analysts or add information please let me know in the comments.
Until When will sustainable like this ?
Downvoting a post can decrease pending rewards and make it less visible. Common reasons:
Submit
Grüezi Chris, just stumbled upon your analysts compilation. lately im interested to start trading cryptos (recently only trading warrants) and this helps!
Gruess us Züri.
Downvoting a post can decrease pending rewards and make it less visible. Common reasons:
Submit
Cool! we should meet some time!
Downvoting a post can decrease pending rewards and make it less visible. Common reasons:
Submit
ye, im always down for a coffee and a chat!
Downvoting a post can decrease pending rewards and make it less visible. Common reasons:
Submit