Regular daily update on BTC ta analysts opinions.

My summary - short-term sentiment: slightly bullish (last: slightly bearish)

- We are in rough territory and look for confirmation in either direction for the mid-term summer setup.
- Short term most of the analysts expects us to go up to the downtrend at 10'000. So we are short term bullish.
News about the blog
- None
Analysts key statements:
Tone:
- Weekly: For him this week is in neutral territory and he needs to see the close of this week to give any new indication. Except we see a major move with clear direction.
- Daily: He isn't expecting the current move up to hold for long. Volume isn't that great and ma 50 and 200 cross are resistance.
@haejin:
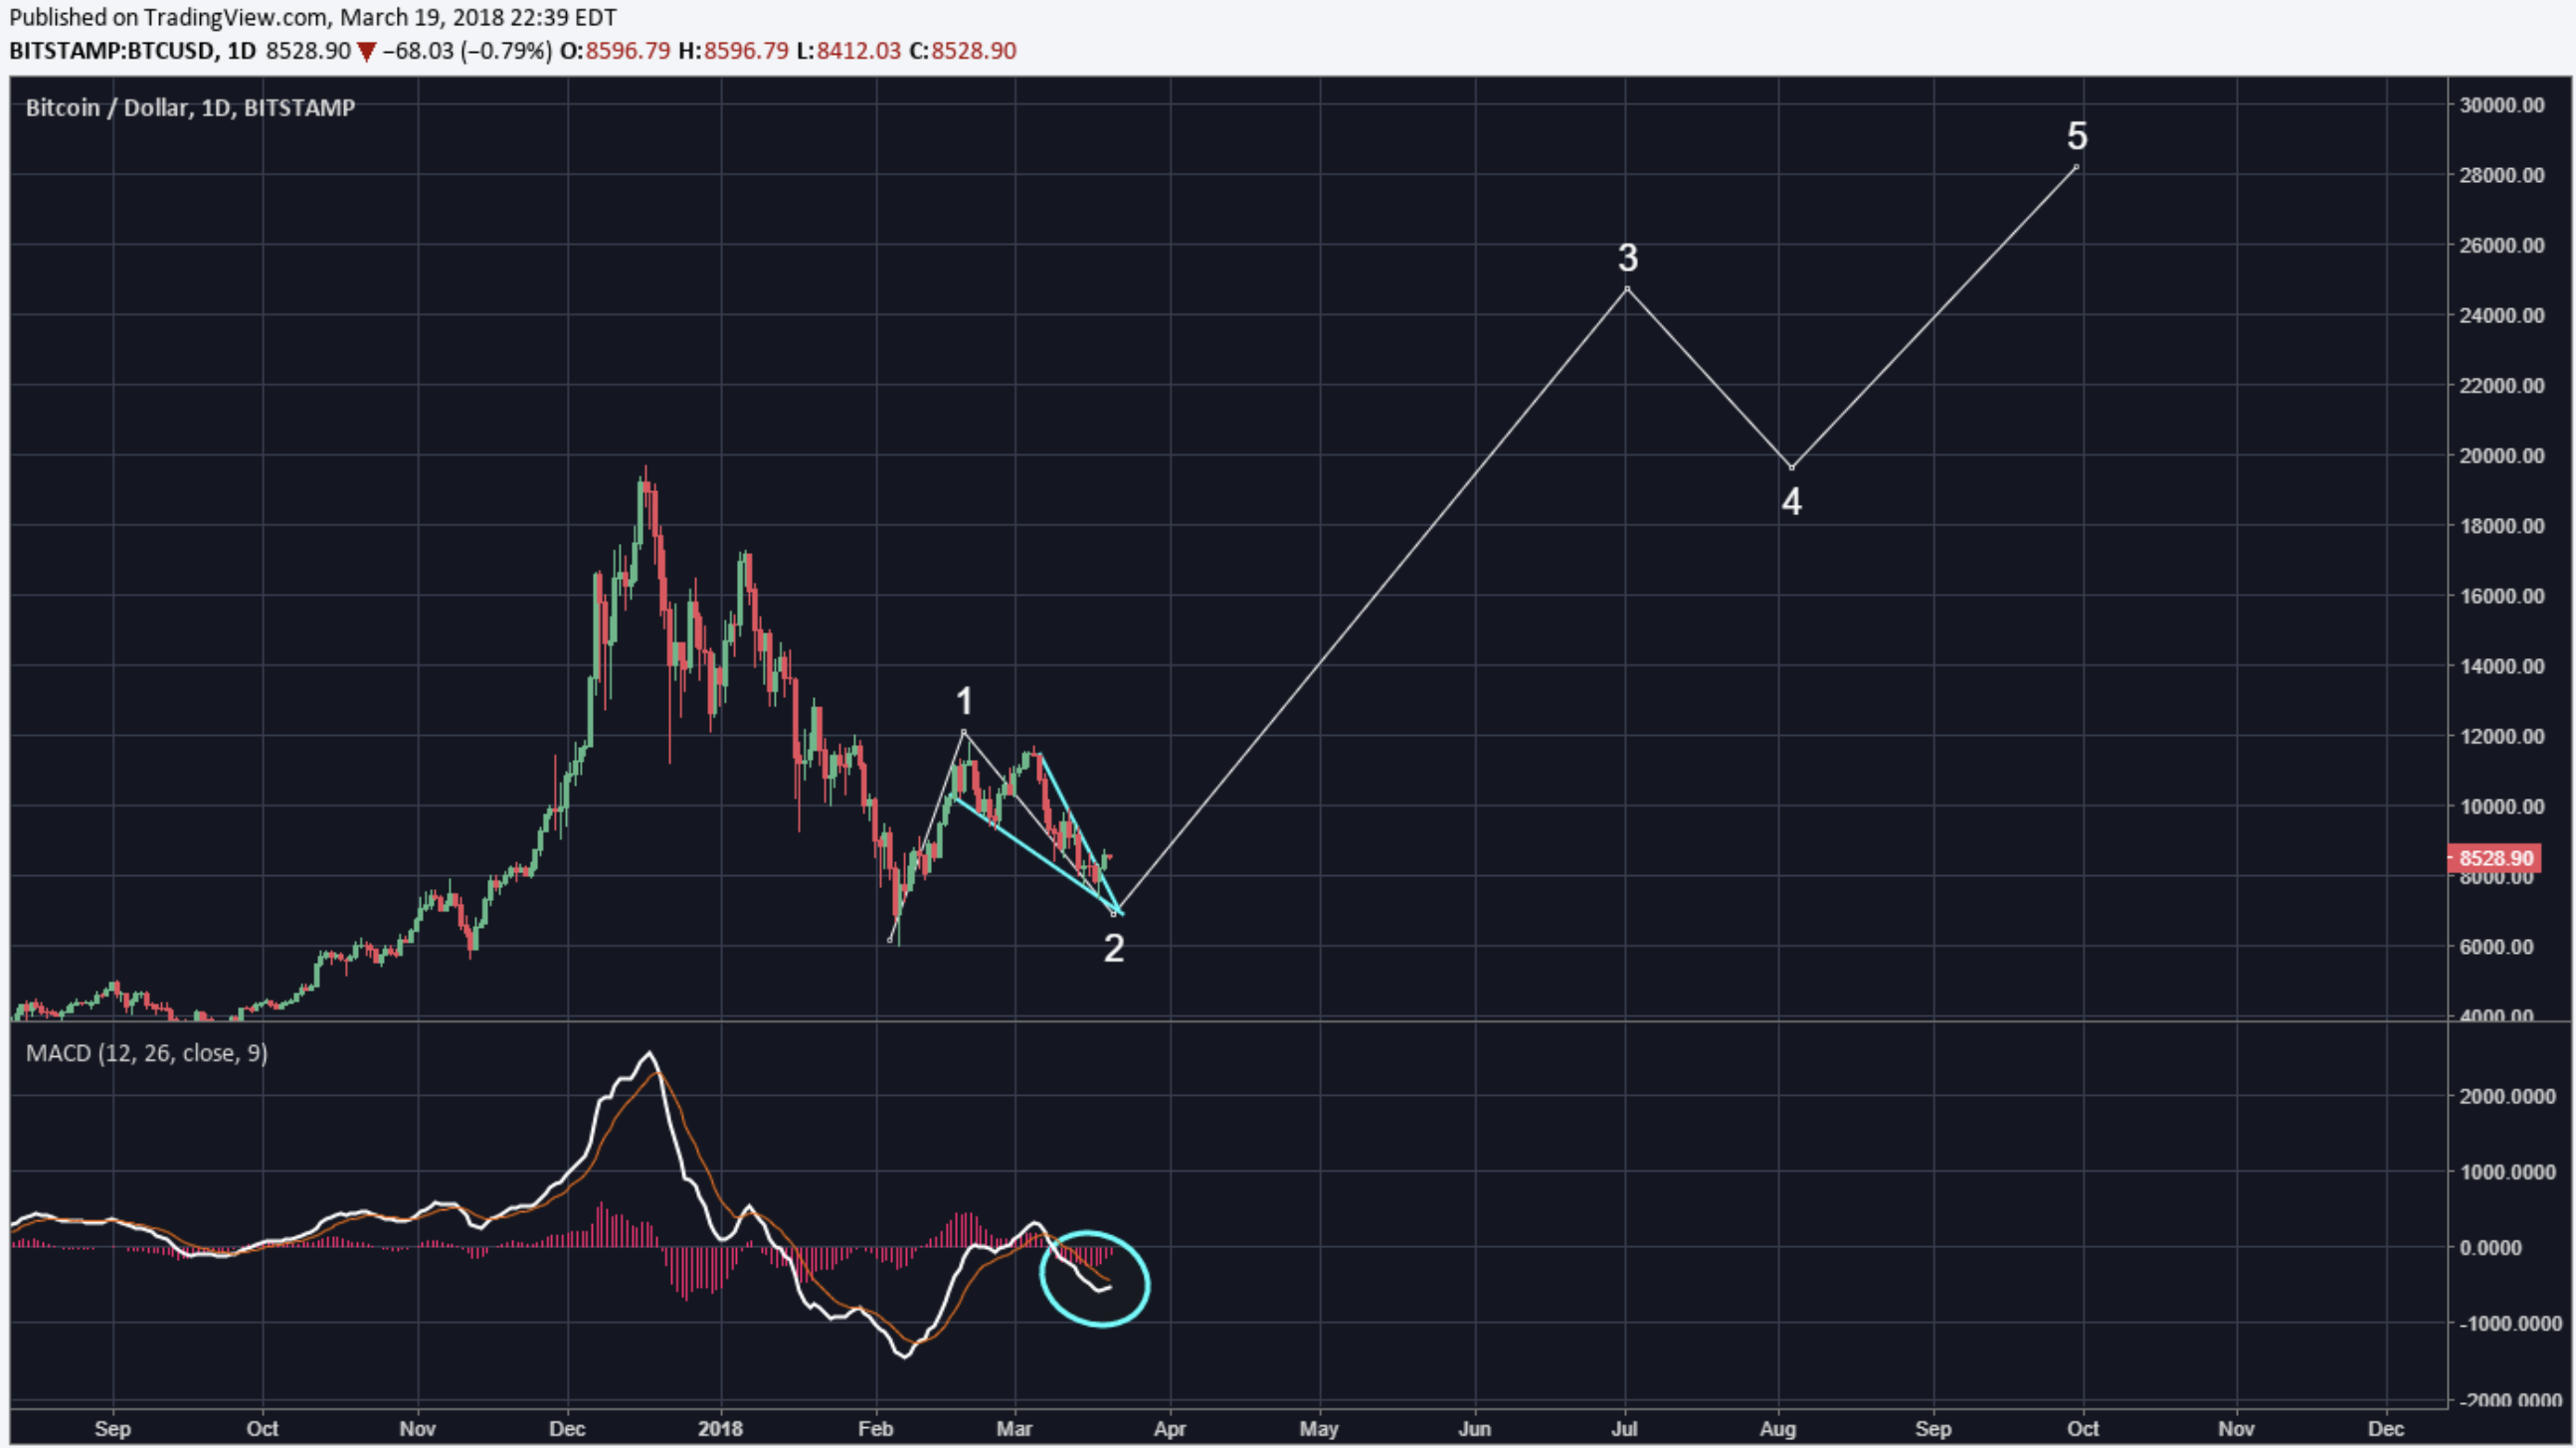
He sees the bigger picture and there his bullish count for new all time highs is still valid. He sees the low for wave 2 is in.

@ew-and-patterns:

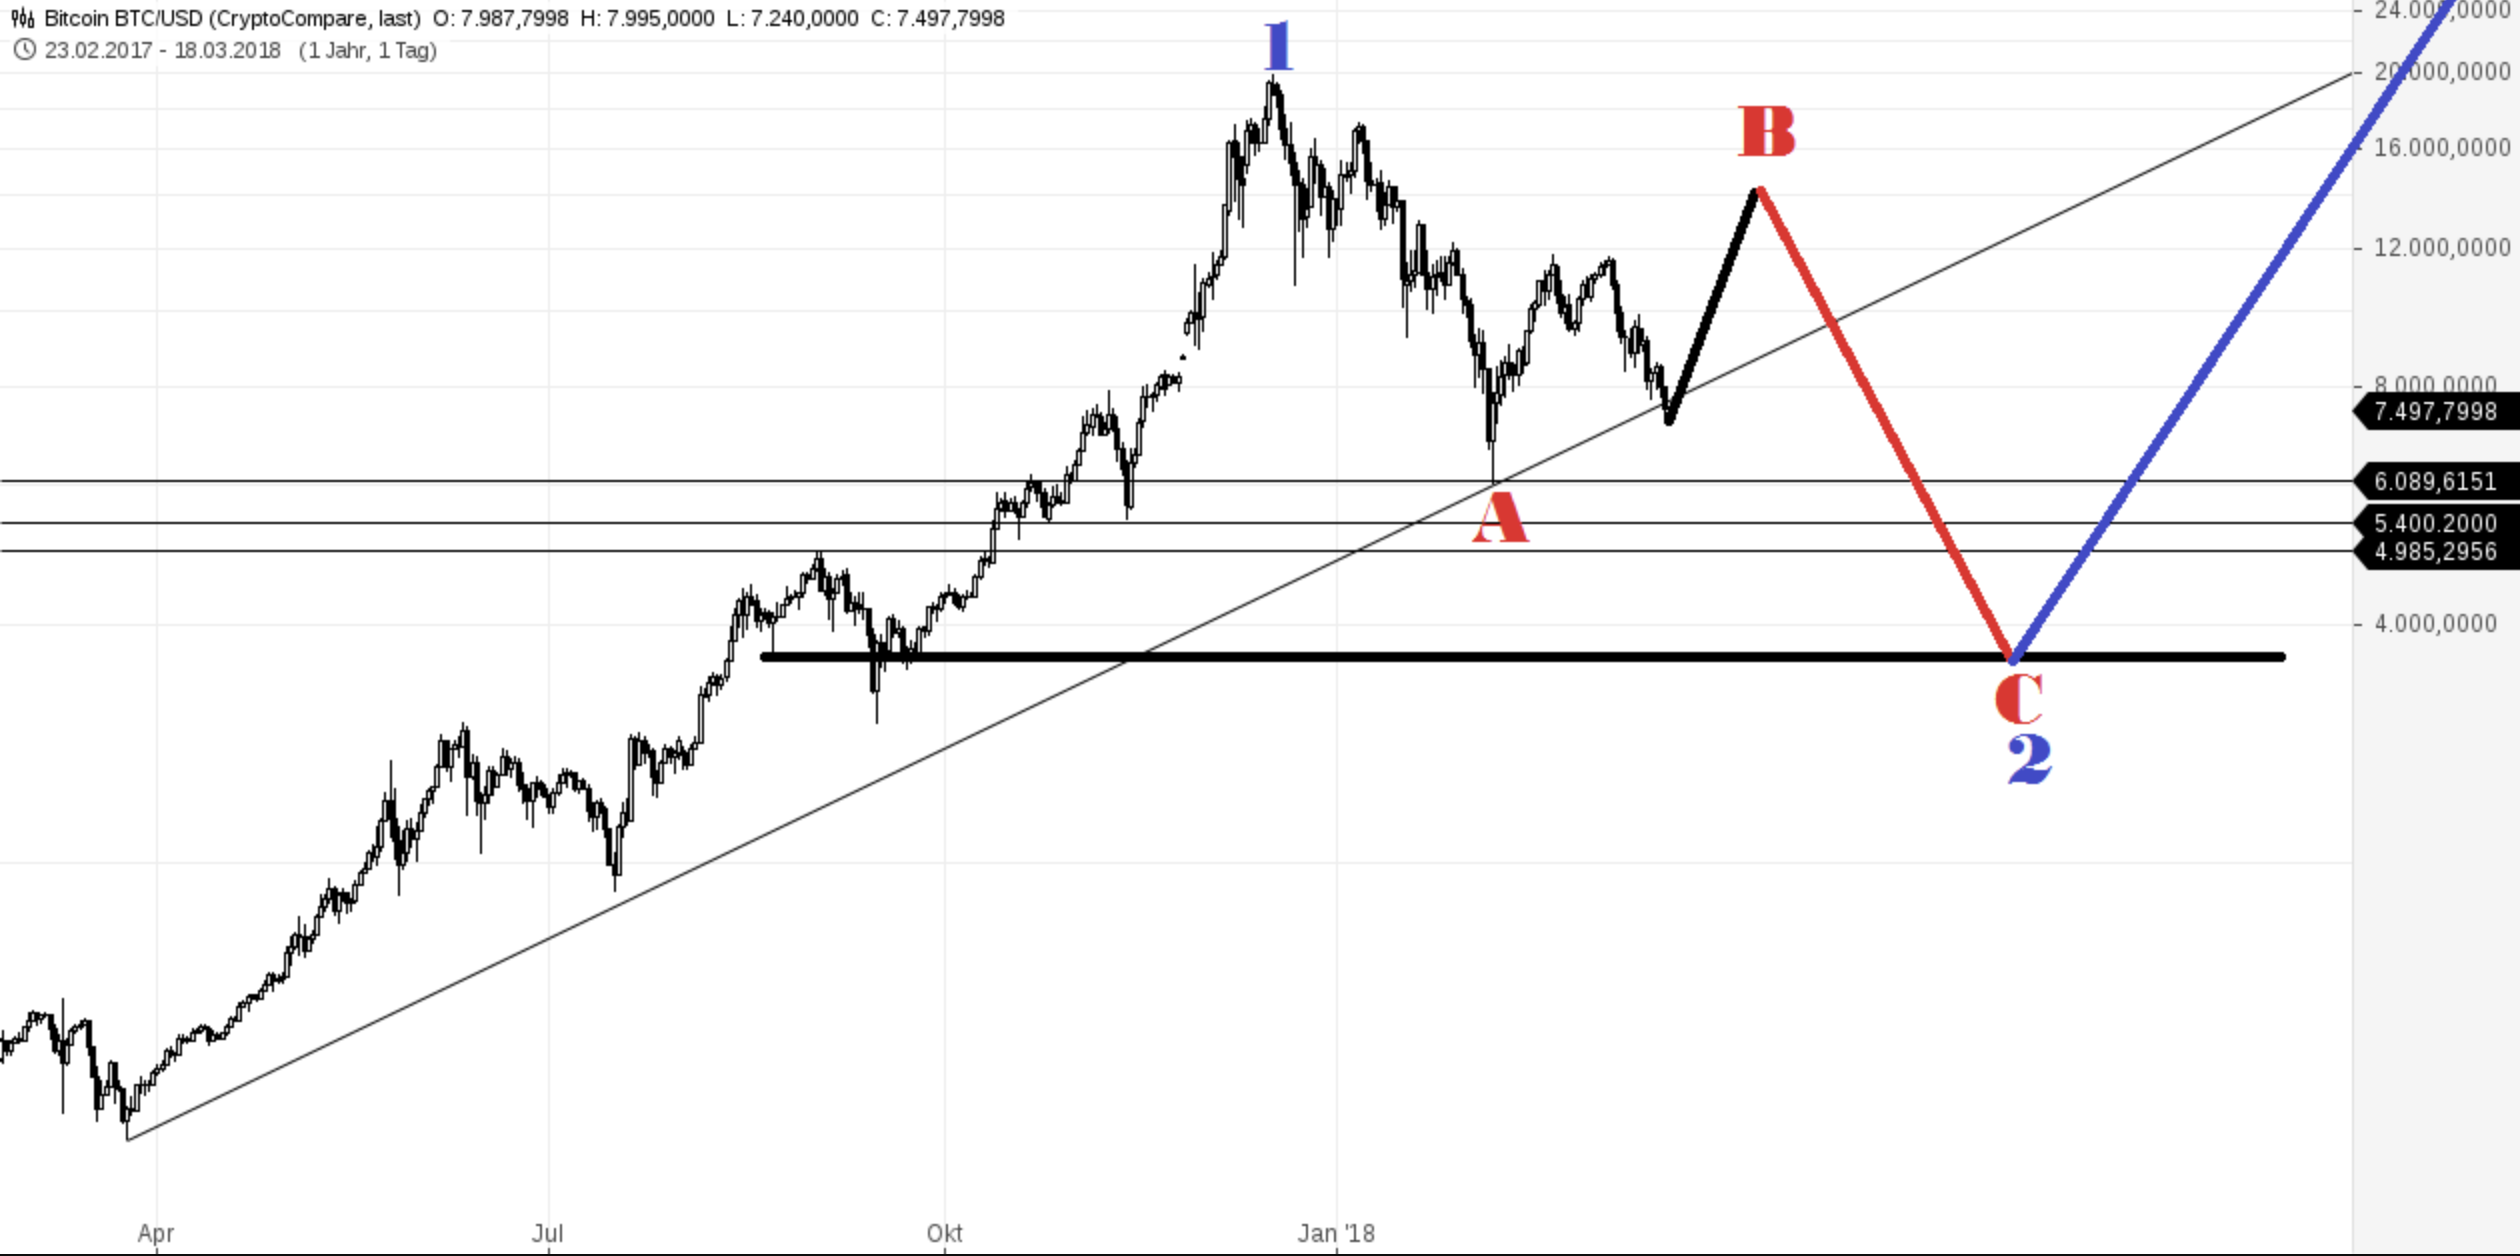
He presents an alternate count for awareness reasons. That one has a target for correction wave C of 4'000.

@lordoftruth:
He sees his pattern confirmed. First jump was to 8'700 and now he es expecting a second jump to 9'400 within next 48 hours.
Todays trend is slightly bullish. Expected trading for today is between 7'660 and 9'400.
@philakonesteemit:
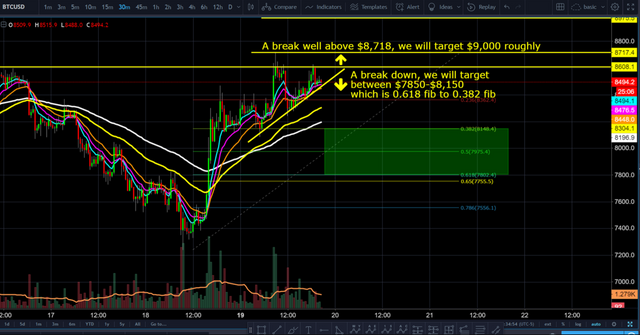
In his bullish scenario he waits till we clear 8'600 followed by a correction confirming 8'600 as support. Than he thinks about playing this and buying into the strength of the bounce from 8'600 as support.
In his bearish scenario 8'600 will reject us and we break down through the short term trend line.

@passion-ground:
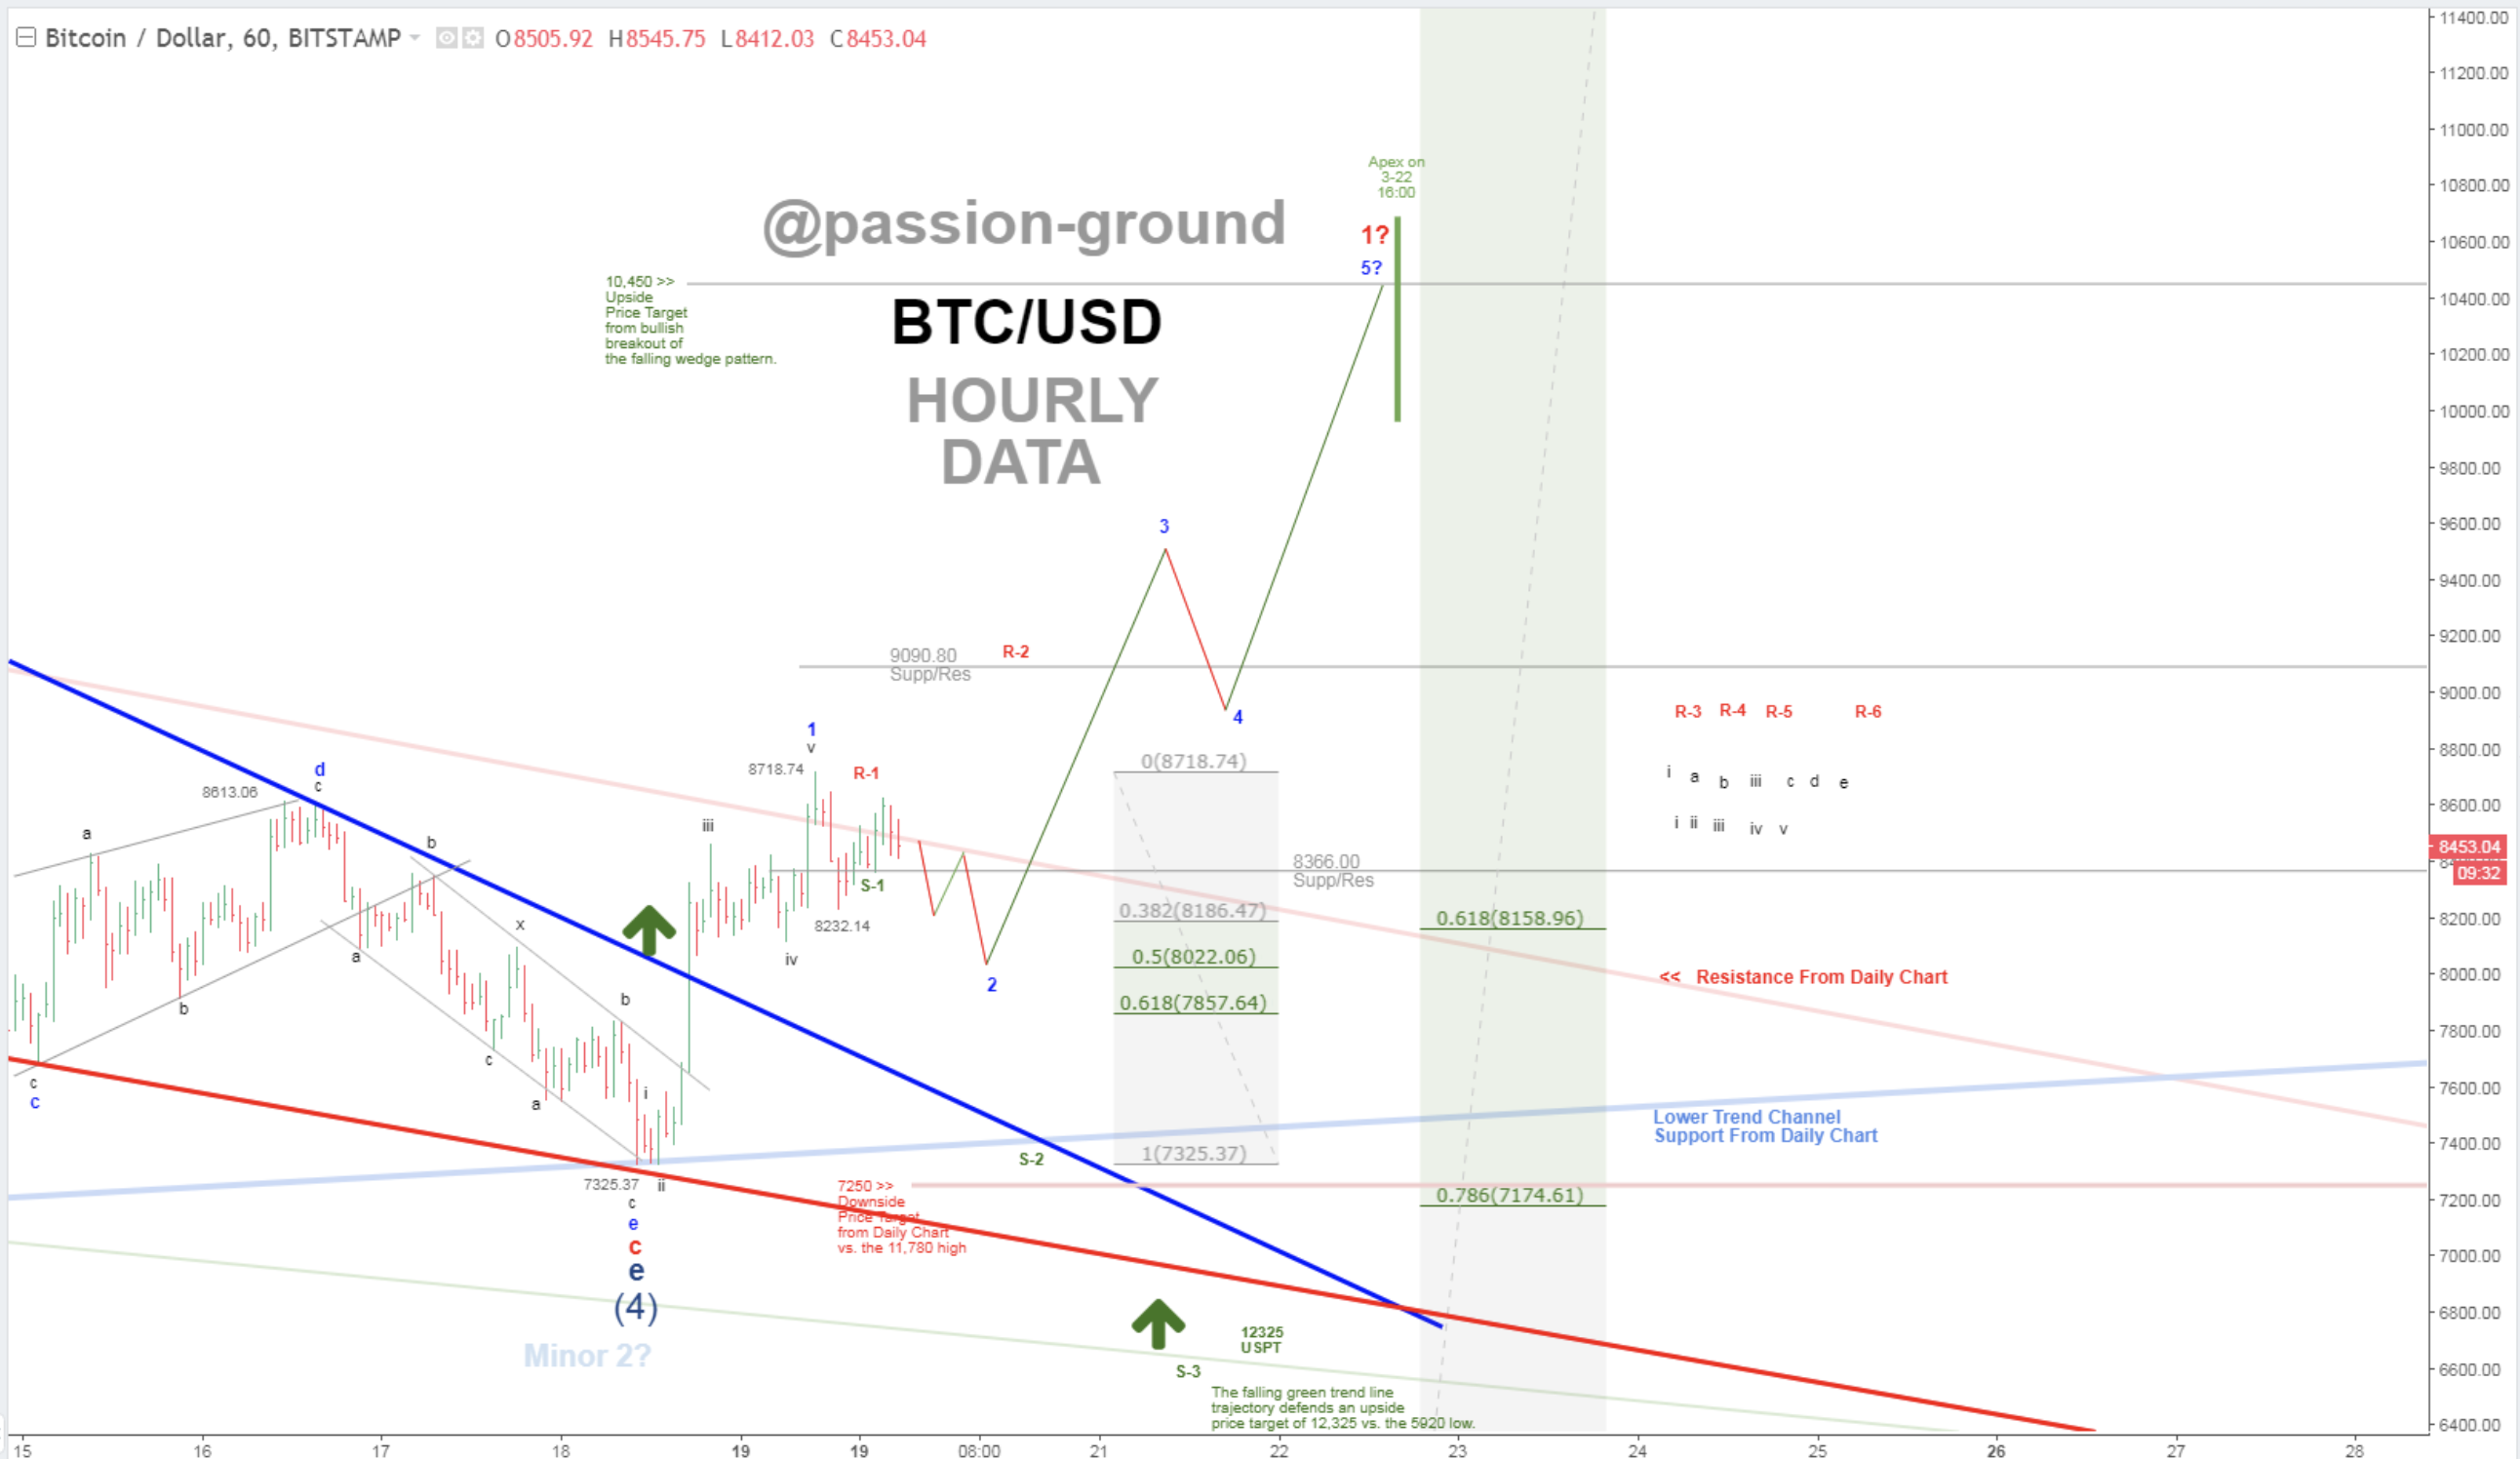
He turns short term bullish. Seeing that we go up to 10'450 after a pull back to 8'022
Also he turned "a bit bearish" on the long-term (6-12 month) perspective de tue how the weekly charts looks like.

Summary of targets/support/resistance


Reference table
| analyst | latest content date | link to content for details |
|---|---|---|
| Tone Vays | 20. Mar | here |
| @haejin | 20. Mar | here |
| @ew-and-patterns | 18. Mar | here |
| @lordoftruth | 20. Mar | here |
| @philakonesteemit | 20. Mar | here |
| @passion-ground | 20. Mar | here |
Definition
- light blue highlighted = all content that changed since last update.
- sentiment = how in general the analysts see the current situation (bearish = lower prices more likely / bullish = higher prices more likely)
- target = the next (short term) price target an analysts mentions. This might be next day or in a few days. It might be that an analyst is bullish but sees a short term pull-back so giving nevertheless a lower (short term) target.
- support/res(istance) = Most significant support or resistances mentioned by the analysts. If those are breached a significant move to the upside or downside is expected.
- bottom = -> now renamed and moved to long term table. Low 2018
- low/top 2018 = what is the low or the top expected for 2018?
Further links for educational purposes:
- From @ToneVays: Learning trading
- From @philakonecrypto: Like in every post you find links to his amazing educational videos. For example here
- From @lordoftruth: Fibonacci Retracement
- From @haejin: Elliott Wave Counting Tutorial
*If you like me to add other analysts or add information please let me know in the comments.
WARNING! The comment below by @fakul leads to a known phishing site that could steal your account.
Do not open links from users you do not trust. Do not provide your private keys to any third party websites.
Downvoting a post can decrease pending rewards and make it less visible. Common reasons:
Submit
Please visit my blog and check out my ideas! Let's exchange opinions for better analysis!
https://steemit.com/@goyapro
Downvoting a post can decrease pending rewards and make it less visible. Common reasons:
Submit
Thanks information about bitcoin @famunger
Downvoting a post can decrease pending rewards and make it less visible. Common reasons:
Submit
thanks for info m8!
Downvoting a post can decrease pending rewards and make it less visible. Common reasons:
Submit
Downvoting a post can decrease pending rewards and make it less visible. Common reasons:
Submit