Regular daily update on BTC ta analysts opinions.

**My summary - short-term sentiment: slightly bearish ** (last: slightly bearish)

Comment unchanged - we are hovering at 7'500 - calm before the storm.
- Critical support seems to be 7'000 - 7'200. This level needs to hold or analysts expects prices below 6'000 soon.
- Some analysts turned bullish seeing 7'200 as bottom and swing low.
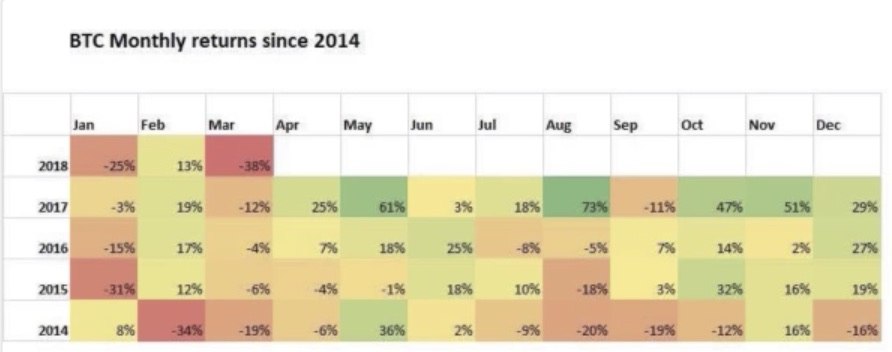
- May is usually a strong month. Lets see how it plays out in 2018.

News about the blog
I need to revise my 2018 long term table. I need to add a 2018 and 2019 target an be more precise on the sentiment here. Will do that after I am back in Switzerland.
We lunched the bounty project beta. If you are interested and you like to create a bounty on your own have a look at this post
Analysts key statements:
Tone:
He sees lower lows and lower highs still confirmed. Therefore no change. We are still hovering at 7'500 area.
- Weekly:
general: Sees strong similarity to 2014 but current environment is even weaker. As we haven't made it above 30 MA and did not bring the 7 MA back above the 30 MA. Instead we are approaching the 50 MA.
In 2014 we dropped 87% - That would give us a target of 2'570. Just for awareness that this correction might not be at its end yet.
We had worse weeks but still it looks bad. We probably close below 50 MA. We spend too much time in the 7'500-7'600. That we bounce from 6'000-6'500 he sees as very unlikely. That we see 10'000 soon is very unlikely. The best case is we go up to 8'000 where lot of people might go to cash or even short bitcoin.
@haejin:
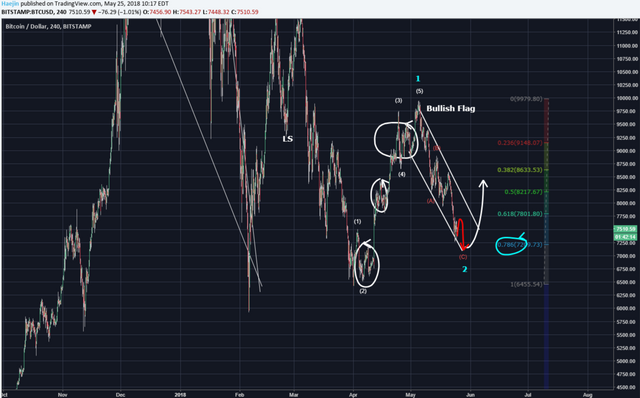
The circled clusters is considered support. When the correct started, there were plenty of sellers and they took down the first cluster with ease. The second cluster wasn't as easy but surely, a significant depletion of would be sellers has taken place. As price now approaches the third cluster, the seller population strength has been severely sapped. Price will attempt to break through but likely fail and mark the bottom of Wave C correction. This is why the bull flag is bullish because with seller depletion, the scale tilts to the buyer side.

@ew-and-patterns:

He thinks the correction is done. We may see one lower low, but I am seeing three bullish patterns in the same wave which is rare.
A popgun, a bullwick and a "M" formation which might actually also be a "bullish butterfly pattern" on the 5min chart.
He also think this an extended 5th. All this turns him bullish for BTC and altcoins.
@lordoftruth:
Looking to the chart, we can see a pretty stable upward channel. If we get a bounce from somewhere around this level, the next stop should be the upper green line, and that would mean 10'158 level.
A clear break below the current support 7'100 - 7'210 area ( Daily Close ) will ultimately move the price below 5'947 towards the next major support level at 5'878.
Todays trend is neutral. Trading between 7'210 and 8'175.
@philakonesteemit:
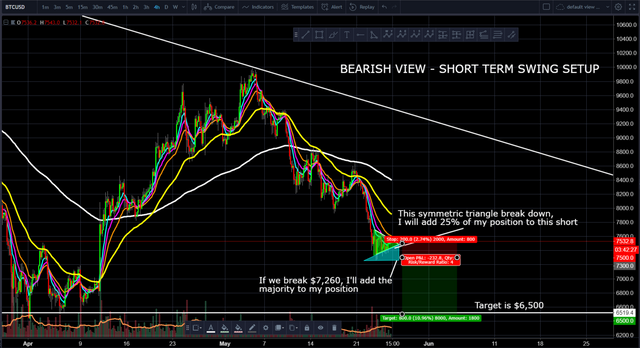
On the bearish side, we break below 7'260, we will most likely test 6'400 - 6'500 range.

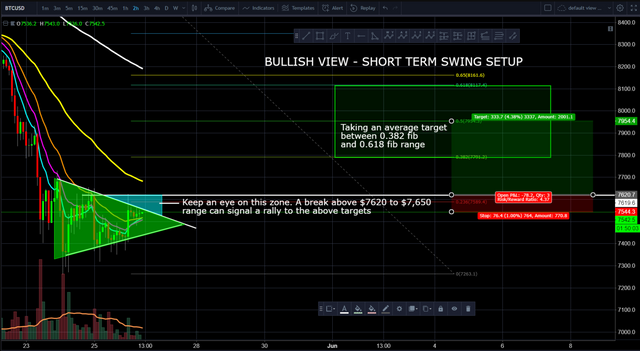
On the bullish side, we break above 7'620 to 7'650 range, we can average a target between 0.618 and 0.382 fib, near 0.5 fib at 8'000.

@passion-ground:

Unless we get a bullish reversal soon, chances of a retest of the last pivot low at 6'611 and thereafter a retest of April's 6'427 low, and then lastly a retest of the current bear market low of 5'920 shall continue to increase.
Looking for a bullish 5-wave impulsive reversal to the upside to mitigate the current downtrend, and raise prospects for a most bullish 3rd wave advance. Until we see such, the bearish downtrend is likely to persist until it finds meaningful support.
Summary of targets/support/resistance


Reference table
| analyst | latest content date | link to content for details |
|---|---|---|
| Tone Vays | 26. May | here |
| @haejin | 25. May | here |
| @ew-and-patterns | 24. May | [here]https://steemit.com/btc/@ew-and-patterns/btc-update-24-05-18) |
| @lordoftruth | 26. May | here |
| @philakonesteemit | 26. May | here |
| @passion-ground | 24. May | here |
Definition
- light blue highlighted = all content that changed since last update.
- sentiment = how in general the analysts see the current situation (bearish = lower prices more likely / bullish = higher prices more likely)
- target = the next (short term) price target an analysts mentions. This might be next day or in a few days. It might be that an analyst is bullish but sees a short term pull-back so giving nevertheless a lower (short term) target.
- support/res(istance) = Most significant support or resistances mentioned by the analysts. If those are breached a significant move to the upside or downside is expected.
- bottom = -> now renamed and moved to long term table. Low 2018
- low/top 2018 = what is the low or the top expected for 2018?
Further links for educational purposes:
- From @ToneVays: Learning trading
- From @philakonecrypto: Like in every post you find links to his amazing educational videos. For example here
- From @lordoftruth: Fibonacci Retracement
- From @haejin: Elliott Wave Counting Tutorial
*If you like me to add other analysts or add information please let me know in the comments.
Thank you for great info @famunger. We need a bullish trend :)
Downvoting a post can decrease pending rewards and make it less visible. Common reasons:
Submit
nothing substantial to add, but just found your page through @jwolf. Was going to flag him for being a shit poster and decided to see who was upvoting him and saw you.
You have good stuff. Him? not so much.
Do you know of the ask-socrates platform? Your stuff has similar levels of details as that one. Again, good stuff.
Downvoting a post can decrease pending rewards and make it less visible. Common reasons:
Submit
This very informative.Thanks and I am following and voting you
Downvoting a post can decrease pending rewards and make it less visible. Common reasons:
Submit