BITCOIN PRICE KEY HIGHLIGHTS
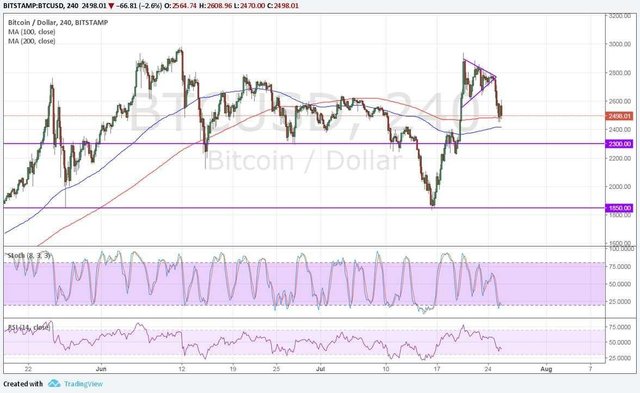
Today price of Bitcoin was consolidating tightly below its all-time highs in a small symmetrical triangle.
Buyers are not strong enough to take it to new highs as price broke to the downside to signal.
Results cryptocurrency back on the next support areas at $2300 then at $1850 back on track towards testing.

Also the price of bitcoin past its recent highs unable to show bullish momentum.
ETHEREUM KEY HIGHLIGHTS
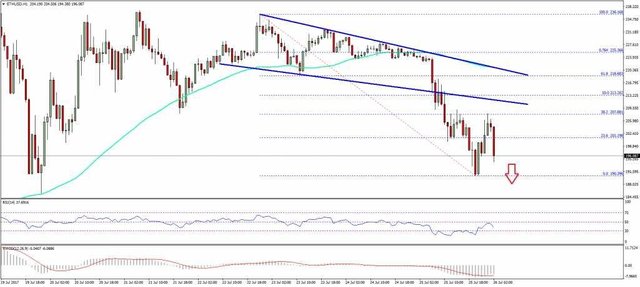
Price of ETH today came under renewed selling pressure and its support against the US Dollar declined below the $212
With support at $212 there was break below a descending contracting triangle on the hourly chart of ETH/USD.
*Ether Price is currently below the $205 support.

There can be more declines as long as its price is below the $218 level. Ignite further declines could break below $190 in the near $180 or $170
HOURLY MACD – The MACD is almost placed solidly now in the bearish zone.
HOURLY RSI – The RSI is currently below the 50 level, and heading lower towards 30
MAJOR SUPPORT LEVEL- $190
MAJOR RESISTANCE LEVEL- $218
The price will continue to drop until the market knows the outcome of Aug 1. I just see this as opportunity to buy the low. Market cap is currently less than $100bn and I believe we get to see 10x that in the next 1-5 years time. I am long on crypto.
Downvoting a post can decrease pending rewards and make it less visible. Common reasons:
Submit
I agree too. With current market cap, an increasing number of transactions, and new products to aid the use of crypto in everyday life. Prospects are good.
Downvoting a post can decrease pending rewards and make it less visible. Common reasons:
Submit
You are right.
Downvoting a post can decrease pending rewards and make it less visible. Common reasons:
Submit
Great analysis by the way! Many people over look structure in technical trading when it's the first thing they should be looking at.
Downvoting a post can decrease pending rewards and make it less visible. Common reasons:
Submit