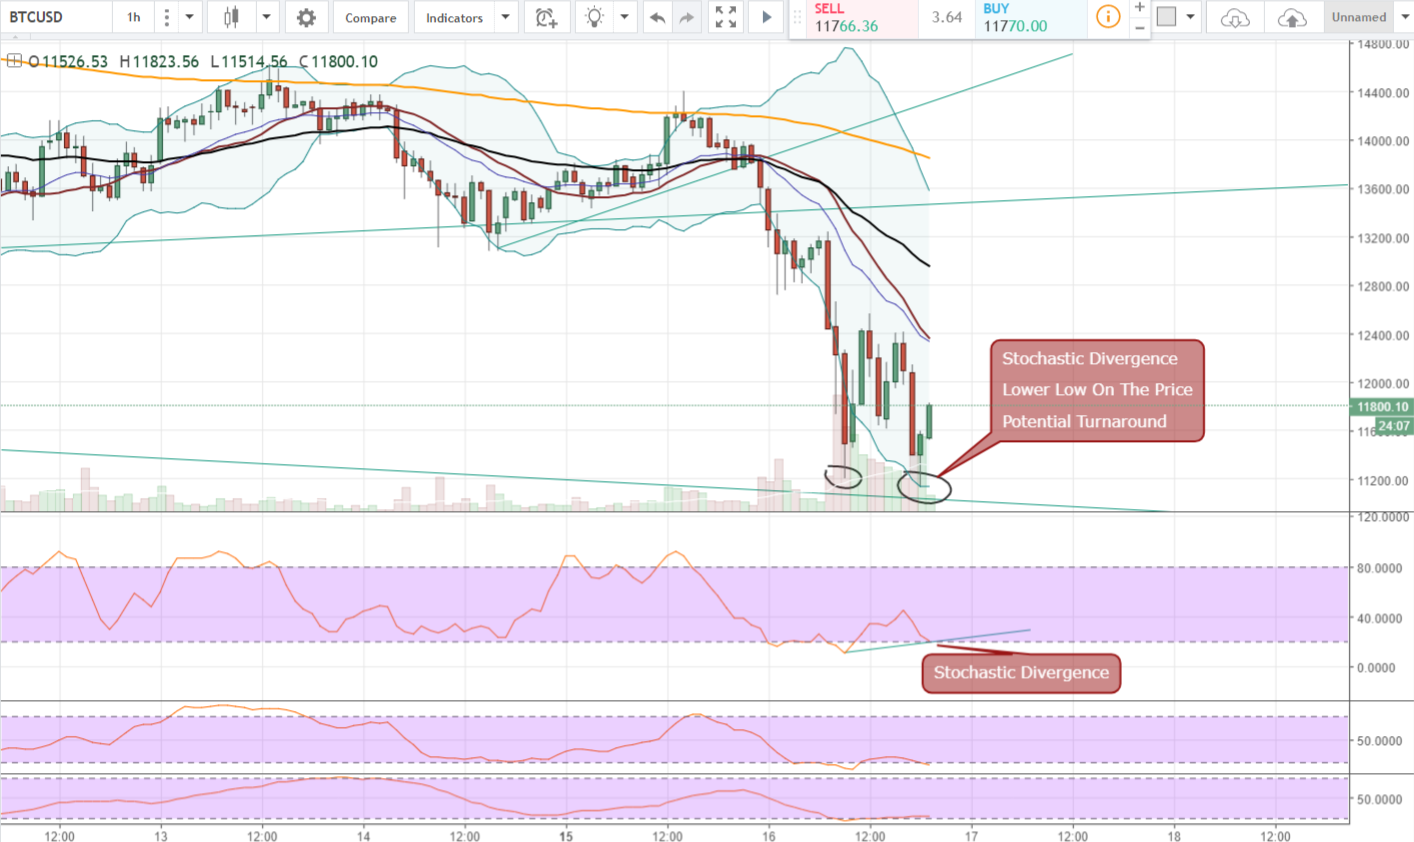
Alright, we might have found a temporary bottom for Bitcoin here. We just got a stochastic divergence. Here it is:

Comment: So what happened here was that Bitcoin took out the old low from earlier this morning and then formed a nice hammer and at this moment we have also got a nice continuation candlestick. Meanwhile on the stochastics (look further down on the chart) the bottom that correspond with the new low of the price is higher than the previous one. This is usually a good sign of a potential reversal.
I will follow up on this when the day close about 4 hours away.
Happy trading!
The reversal is more likely to happen tomorrow.
Downvoting a post can decrease pending rewards and make it less visible. Common reasons:
Submit
Hold tight! We have seen such bearish moves. This is very good opportunity to buy. Just buy it. We will jump soon.
Downvoting a post can decrease pending rewards and make it less visible. Common reasons:
Submit