Today's crypto market is moving again in the green zone, with Bitcoin up 2.56%, Ethereum up 0.92%, and Solana up 10.26%. Bitcoin reached a new ATH of $73,637.47. Solana experienced the highest increase today and took the price to a high of $166.45.
The Fear and Greed Index shows a value of 90, indicating extreme market greed for crypto assets.
Bitcoin/USD technical analysis today
Positive news for Bitcoin Bank of America and Wells Fargo, two major US banks, now allow their clients to invest in Bitcoin via ETFs.
Today Bitcoin offers a trading range performance of Low $71,334.09 and High $73,637.47
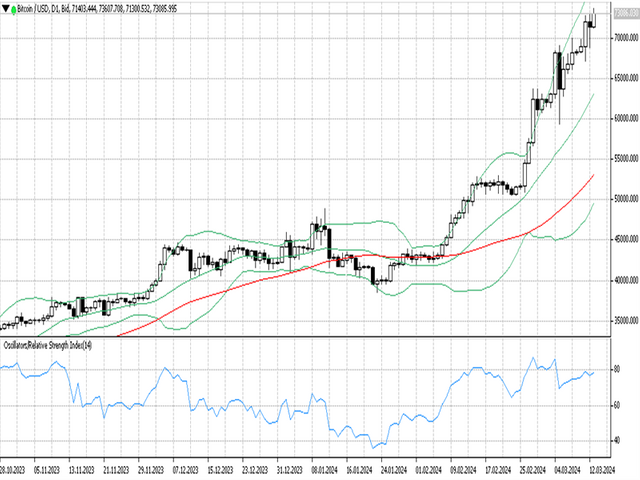
Bitcoin again hit a new all-time high at $73,637.47 a few hours ago. This forms a bull candlestick with a higher high.
Bitcoin's market capitalization has almost reached 1.5 trillion USD to date and is the cryptocurrency most widely held by investors with a ratio of 60% according to Coindesk data.
Investing's summary of technical indicators today provides a buy signal. Meanwhile, moving averages with varying periods also provide buy signals.

On FXOpen Ticktrader, the Bitcoin/USD price is now below the upper band line and forming a bull candlestick with a short shadow above the candle.
On the daily timeframe, the Bollinger band which draws an upward channel with a wide distance between the upper and lower bands indicates bullish sentiment with high market volatility.
The 50 MA is above the lower band still forming an upward channel which indicates a market uptrend with strong momentum.
On the other hand, the RSI indicator, which is often used to measure overbought and oversold prices, shows level 79, which means the price has entered the overbought zone.

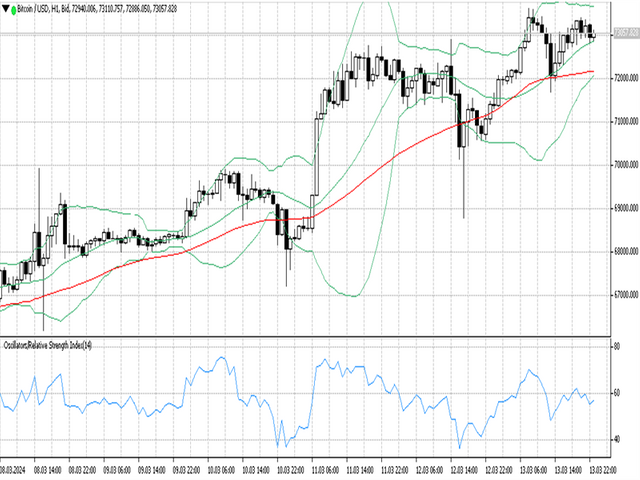
On the H1 timeframe, Bitcoin price is currently moving near the middle band line, this is a pivot zone where price consolidation often occurs. Here the Bollinger bands draw a flat channel with the band spacing showing an indication of decreasing volatility.
MA 50 is above the lower band line starting to form a flat channel which indicates a sideways market.
The RSI indicator in this timeframe shows level 56, which means the price is above the uptrend level.
Support and resistance
S3: 25954.7
S2: 38471.6
S1: 47669.6
R1: 73611.9
R2: 73611.9
R3: 73611.9