What a day, Bitcoin updated again a new all-time high of $72,850.71 a few hours ago.
Of the 100% of crypto investors, 60% of investors hold Bitcoin, 21% hold Ethereum, and the rest are spread across other cryptos including Solana, XRP, Cardano, and others.
According to WatcHerGuru MicroStrategy buys an additional 12,000 #Bitcoin ($821 million). This may be one of the triggers for #Bitcoin's rising today.
Bitcoin/USD Technical analysis today
According to Investing, today's summary of technical indicators and moving averages gives a strong buy signal.

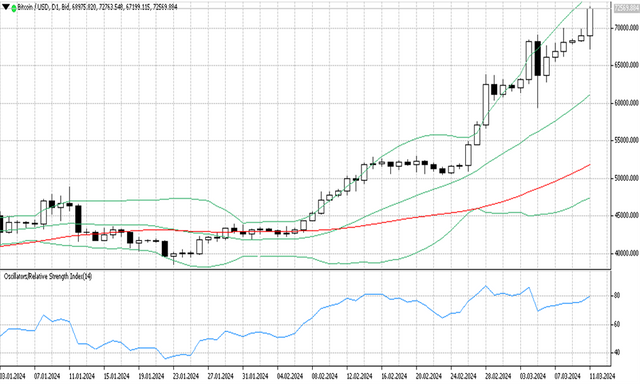
On Ticktrader FXOpen, Bitcoin/USD is now forming a bullish candlestick with a long body indicating a strong uptrend with a slight shadow on the top candle.
Price is still moving below the upper band line and trying to reach the line.
The Bollinger band structure has not changed much, it still forms an upward channel with a wide band distance indicating an uptrend with high market volatility.
The 50 moving average has not changed much, forming an upward channel above the lower band line indicating an uptrend market.
On the other hand, the RSI indicator shows level 80, which means the price is in the overbought zone. RSI is a leading indicator that provides signals before a trend is formed. This can be an early indication of a possible correction.

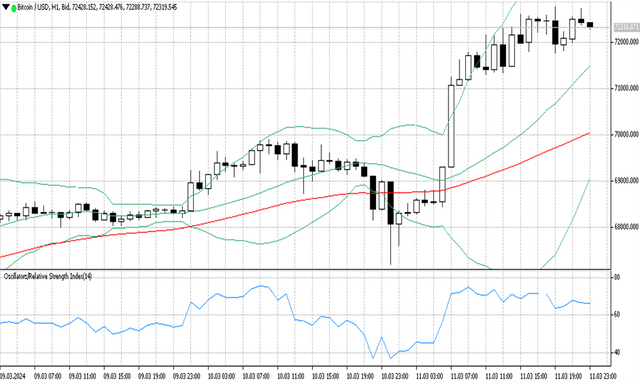
On the H1 timeframe, the uptrend rally started to weaken as indicated by the candlestick patterns starting to line up. Here the Bollinger bands appear to be expanding, indicating high market volatility.
On the other hand, the MA 50 forms an upward channel below the middle band line, an indication of an uptrend market with strong momentum.
The RSI indicator shows a value of 65, which means the price is above the uptrend level.
Support and resistance
Bitcoin has reached a new all-time high which may be a resistance point at the moment, if another upside breakout occurs it will make a change to the All time high.
The support zone-based middle band line which is the first support zone shows at roughly $714100. Meanwhile based on MA 50 at roughly $70000. Next support is based lower band at roughly $69000
Bitcoin prices may continue to be positive because Micro Strategy drives the value of BTC up significantly. However, several technical indicators show that the price is already in the Overbought zone, this allows for a reversal.