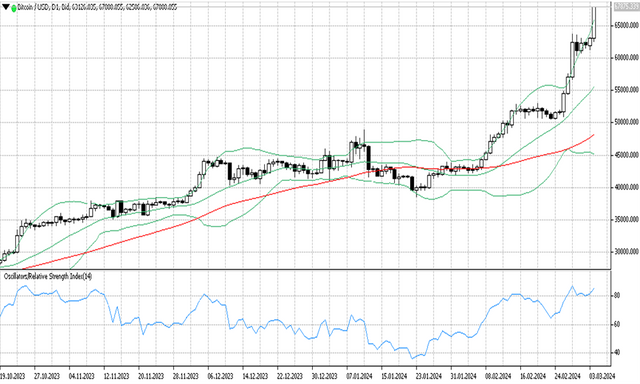
The price of Bitcoin was seen surging again at a high level of $67,926.93, almost reaching the ATH value of $69k.
The Fear and Greed Index shows a value of 86, which means the market has extreme greed for crypto assets.
Reporting from Coingape, there is news regarding the value of Bitcoin that, MicroStrategy announced a $600 million private offering of convertible senior notes to increase its Bitcoin investments.
BTCUSD technical analysis
Referring to the summary of technical analysis by Investing Today, it still provides a strong buy signal. RSI(14) Overbought, STOCH(9,6) Overbought, STOCHRSI(14) Buy, MACD(12,26) Buy, ADX(14) , Williams %R Overbought, CCI(14) Buy, ATR(14) Less volatility, Highs/Lows(14) Buy, Ultimate Oscillator Overbought, ROC Buy, and Bull/Bear Power(13) Buy.

On Ticktrader FXOpen BTCUSD appears to be above the upper band, the price breaks the upper band and is outside the line indicating a strong uptrend is occurring.
The Bollinger band line still has a wide upper and lower band distance, an indication of high market volatility.
MA 50 is forming an ascending channel near the lower band line, indicating strong bullish momentum.
The RSI indicator used to measure the overbought and oversold zone shows level 83, which means the price is in the overbought zone.

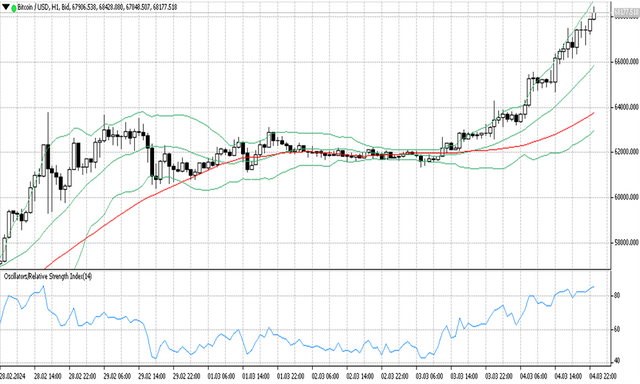
BTCUSD on the H1 timeframe shows strong bullish sentiment. Here you can see the Bollinger band expanding where the upper and lower bands move away from each other.
The price is below the upper band line now and is still forming a bull market pattern.
The 50 MA is above the lower band forming an upward channel indicating bullish momentum.
The RSI indicator shows a value of 85 which means the price is in the overbought zone.
Support and resistance
S3: 24877.1
S2: 38471.6
S1: 42186.2
R1: 67501
R2: 67501
R3: 67501