The cryptocurrency market bullish sentiment persisted in 7 days, Bitcoin rose 10.28%, Ethereum rose 16.58%, and Solana rose 16.09%.
Today's Fear and Greed Index value shows 88 indicating the market extreme greed.
Today's Bitcoin price performance in 24 hours is in the range of Low $65,655.53 and High $68,029.92.
Bitcoin has updated a new ATH of $69,170.63 on March 5, 2024.
BTCUSD technical analysis today
Today the summary of hourly timeframe technical indicators by Investing shows a neutral signal. The hourly timeframe is often used by intraday traders who open and close positions on the same day.
The details of the technical indicators are RSI(14) Neutral, STOCH(9,6) Overbought, STOCHRSI(14) Oversold, MACD(12,26) Buy, ADX(14) Neutral, Williams %R Overbought, CCI(14) Neutral, ATR(14) lower volatility, High/low(14) Neutral, Ultimate OScillator Sell, ROC Buy, Bull/Bear Power(13) sell.

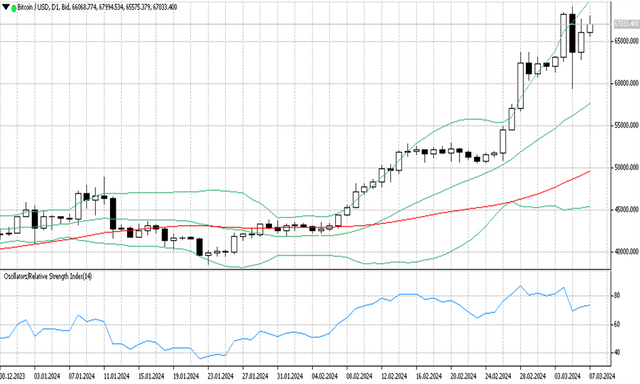
Bitcoin price on Ticktrader shows the price moving below the upper band line and around 2.75% below the ATH in the price range of $67k.
In the daily timeframe, BTCUSD is still trying to be bullish by forming a bullish candlestick but still with a small body.
The price tends to consolidate and move below the ATH, if there is a breakout of the ATH value once again, it may take the price even higher.
Bollinger bands show high market volatility seen from the wide range of the upper and lower bands.
The 50 MA above the lower band forms an upward channel far below the price which indicates a bullish trend with strong momentum. On the other hand, the RSI shows a value of 73, which means the price is in the overbought zone.

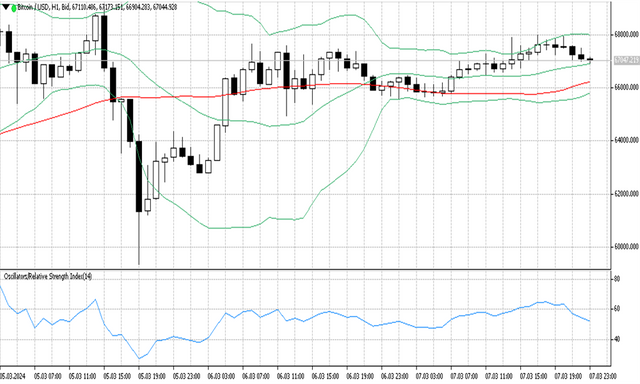
On the H1 time frame, BTCUSD is moving flat which creates Bollinger band pressure waiting for a breakout. The 50 MA below the price also forms a flat channel indicating a sideways market.
The RSI indicator shows a value of 50 which means the price is in the neutral zone.
Support and resistance
S3; 24877.1
S2: 38471.6
S1: 42488.3
R1: 69091
R2: 69091
R3: 69091