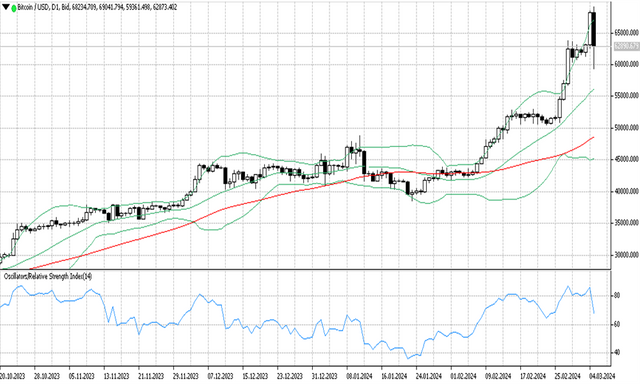
Today Bitcoin fell to a low of $59,323.91 after reaching a High $69,170.63. It seems that many Bitcoin holders have taken profit taking which caused the price to fall shortly after reaching the new ATH.
The average cryptocurrency today was observed to fall with varying degrees of decline, Bitcoin down 6.77%, Ethereum down 2.90%, BNB down 6.61%, Solana down 7.19%, and XRP down 9.87%. Dogecoin experienced the highest decline of 14.81% after previously recording the highest increase of 54% in 7 days.
The Fear and Greed Index shows a value of 90, which means the market is extreme greed and may almost reach a peak that allows correction.
BTCUSD technical analysis
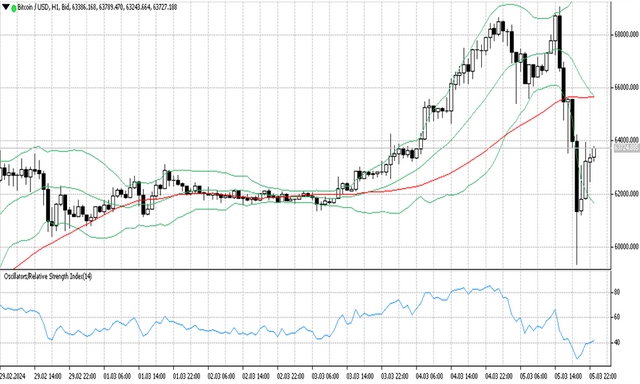
Bitcoin is now trading at $63k and is seen fluctuating near the upper band line.
Referring to the summary of technical indicators by Investing Today, on average, they give strong sell signals. RSI(14) Sell, STOCH(9,6) Overbought, STOCHRSI(14) Sell, MACD(12,26) Sell, ADX(14) Neutral, Williams %R overbought, CCI(14) Sell, ATR(14) high volatility, Highs/Lows(14) Sell, Ultimate Oscillator Sell ROC Sell, and Bull/Bear Power(13) Sell.

On #Ticktrader FXOpen the price of BTCUSD appears to form a bearish candlestick with a long shadow at the bottom of the candle, this reflects the price of #Bitcoin falling very deep and trying to return to its initial track.
On the daily timeframe, the Bollinger band indicator is seen still giving high volatility signals from a very wide distance between the upper and lower bands. The middle band line which reflects the MA 20 forms an upward channel indicating an uptrend market. The MA 50 which measures the average of the past 50 days has formed an upward channel near the lower band line, an indication of bullish momentum.
The RSI is seen forming a steep line from the upper to the lower side at level 67, which means the price is out of the overbought zone but is still above the uptrend level.

In the H1 timeframe, BTCUSD moved up after a sharp decline from near the upper band line and a breakout of the lower band line which caused volatility to increase. This can be seen from the expanding Bollinger band line.
MA 50 is near the middle band line forming a flat channel indicating a downtrend because the price is below the MA line. On the other hand, the RSI indicator shows level 41 trying to get out of the oversold zone.
Support and resistance
S3: 24877.1
S2: 38471.6
S1: 42186.2
R1: 69091
R2: 69091
R3: 69091
Conclusion
BTCUSD may enter a consolidation phase after reaching a new all-time high. Bitcoin's drastic decline reflects profit-taking by Bitcoin holders. However, there is still potential for Bitcoin to rise again because the Bitcoin halving which is expected to occur in April could trigger investors to speculate on Bitcoin.
