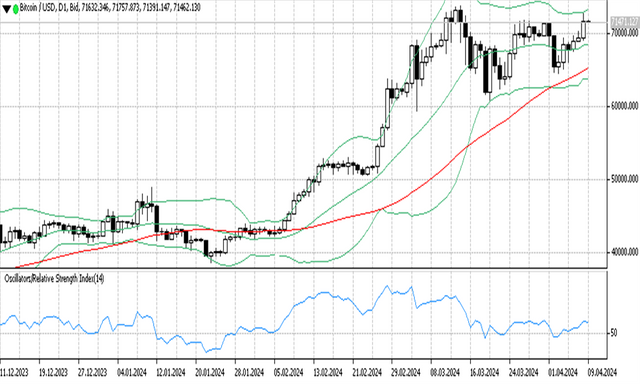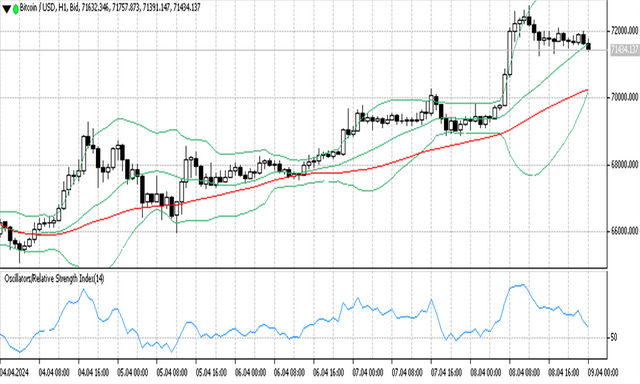
The price of Bitcoin is currently rising at around $71k, the surge in Bitcoin prices was driven by positive sentiment. The inflow of $646 million into cryptocurrency investment products last week raised the total to an unprecedented $13.8 billion this year.
Sees Bitcoin and gold lately as if there is competition in these two markets where when gold moves stagnant on the other hand Bitcoin is bullish and when Bitcoin corrects, the price of gold soars. Could the two go hand in hand as a safe haven?
SkyBridge Capital’s CEO Anthony Scaramucci predicts Bitcoin could reach $170k. while some gold analysts predict gold prices could reach $3000.
From another perspective, ARK Invest CEO Cathie Wood sees Bitcoin as a hedge against currency devaluation and wealth erosion.
"I think this is an insurance policy against rogue regimes or against bad fiscal and monetary policies," he explained, as quoted by Bitcoin News.
According to him, the spike in Bitcoin prices was not only due to the impact of funds in the Bitcoin ETF exchange, but also due to currency devaluation, such as what happened in Nigeria, where the Naira fell 50-60% in 9 months, Argentina and Egypt, which also experienced devaluation.
Bitcoin/USD technical analysis today
Bitcoin price appears to rise again forming a bullish candlestick with lows of $ 69,110.5 and 72,710.8.
A summary of several technical indicators and several moving averages by Investing in the hourly period shows a buy signal.

On Ticktrader the price moves slightly below the upper band line. It appears that the price touched the upper band line and then rebounded slightly to $71492.
Bollinger band line on daily timeframe still forms a flat channel indicating a sideways market. A breakout of the upper band means the price will break out and look for a new higher high.
MA 50 forms an ascending channel below the price slightly above the lower band line indicating an uptrend market.
On the other hand, RSI, which is an indicator for measuring overbought and oversold prices, shows level 57, meaning prices are moving above the uptrend level.

On the H1 timeframe, Bitcoin price is consolidating after yesterday's rally. This can be seen from the small candlesticks lined up near the middle band line.
The Bollinger Band indicator appears to be expanding in this time frame, reflecting an increase in market volatility in this time frame.
MA 50 formed an ascending channel near the lower band line, indicating that bullish sentiment is still dominant.
The RSI indicator shows level 56 in this time frame, giving a signal that the price is above the uptrend level.
Support and resistance
S3: 71138.7
S2: 71380.7
S1: 71505.4
PP: 71747.3
R1: 71872
R2: 72113.9
R3: 72238.6