Today's average cryptocurrencies are moving in the red zone. Bitcoin up 0.30%, Ethereum down 1.72%, Solana down 1.50%,
The Fear and Greed Index shows a value of 89, which means market extreme greed.
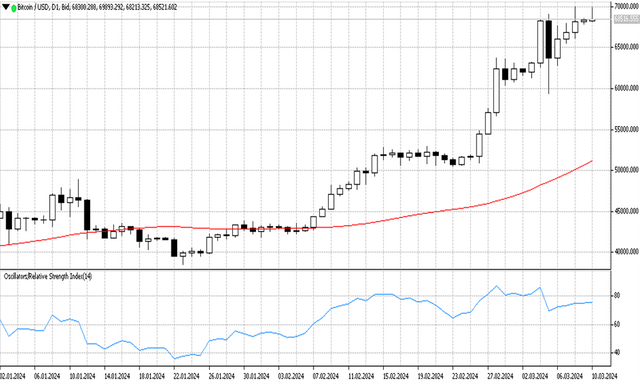
Bitcoin's bull run seems to be weakening and holding at ATH $70,083.05. Bitcoin/USD price is now $68516.555 on Ticktrader FXOpen.
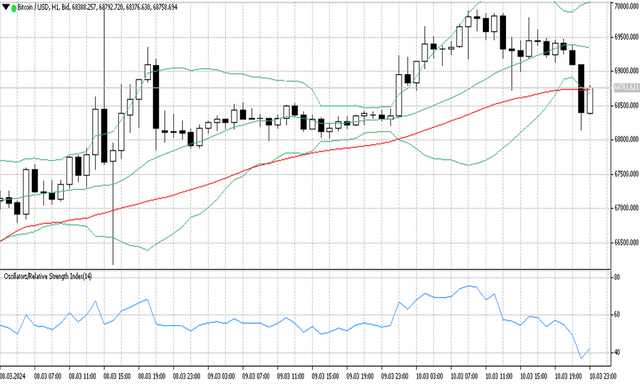
#Bitcoin price appears below the upper band line and appears to be starting to move away from the line. Bitcoin/USD trading range in 24 hours with a Low of $68,367.49 and a High of $70,005.20.
Some investors still believe Bitcoin will hit $76k soon like Jimmyboss who posted his positive attitude towards Bitcoin on Coinmareketcap.
Bitcoin USD technical analysis today
Bitcoin price forms a hammer candlestick which reflects the price of Bitcoin after rising to a high of $69893 then falling and closing at 68152. The hammer candlestick can be a reversal pattern characterized by rejection.

On the daily timeframe, the BTCUSD price is now moving below the upper band line and the upward trend is weakening as seen from the small candlestick body that formed after reaching the new ATH.
The Bollinger band indicator is still forming an upward channel with a wide band distance indicating high market volatility.
MA 50, which measures the average close price for the past 50 days, forms an upward channel above the lower band line, an indication of an uptrend market.
The RSI indicator, which is often used to measure overbought and oversold prices, has shown that the price is now at level 77, which means the price is in the overbought zone.

In the H1 timeframe, BTCUSD is now moving below the lower band line. The price appears to have fallen sharply and crossed the lower band line and MA 50 from the upper side.
The Bollinger band line appears to be expanding in this time frame, indicating an increase in market volatility.
MA 50 forms a flat channel just above the price indicating a sideways market.
Support and resistance
S3: 24877.1
S2: 38471.6
S1: 42723.8
R1: 69991
R2: 69991
R3: 69991