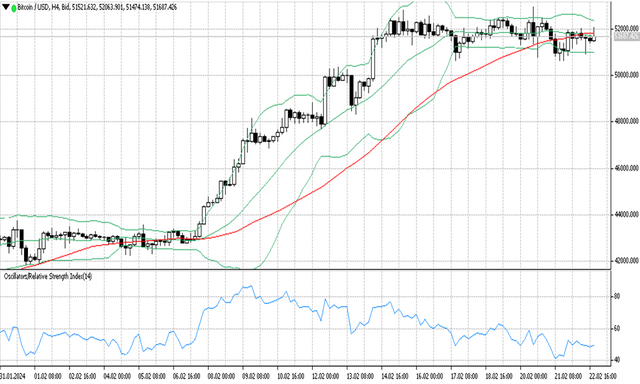
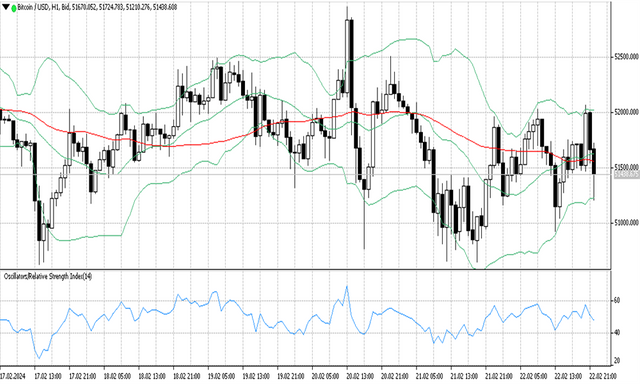
Bitcoin still tends to move in a consolidation phase waiting for the Bollinger band squeeze breakout.
Some investors see bullish potential still existing before the halving. On weekly, two long candlesticks indicate strong bullishness. However, RSI entered the overbought zone.
Today the average cryptocurrencies move up and down positive and negative, Bitcoin up 0.53%, Ethereum up 2.14% BNB up 2.13%, Solana down 1.23%, XRP down 0.03%.
The Fear and Greed Index value at 73 is down 2 points from 75.
Price range in 24 hours latest Low $50,926.29 and High $52,009.61
Arthur Hayes, the co-founder of BitMEX believes Bitcoin can reach a new high because it is driven by supporting factors.
Hayes pointed to spot ETF accumulation, along with a possible Federal Reserve interest rate cut, as the main drivers of Bitcoin's projected rise to unprecedented levels.
BTCUSD technical analysis
This week Bitcoin price movements tend to be in a consolidation phase where the price moves in the $50K-$52K range. After a long rally for two weeks, it appears that the uptrend is starting to weaken as seen from the candlestick patterns which tend to line up to form flags.
On the daily timeframe the Bollinger band still appears to be expanding but the RSI is trying to get out of the overbought zone. MA 50 is still forming an upward channel below the middle band, an indication that the uptrend market is still dominating in the long term.

In the H4 timeframe, a Bollinger band squeeze appears, indicating market volatility is starting to weaken. If there is a downside breakout, it might bring Bitcoin down to find new support, but if there is an upside breakout, it might bring Bitcoin back up again.

In the H1 timeframe, prices tend to go up and down forming swing highs and swing lows in the Bollinger band, here the upper band becomes dynamic resistance and the lower band becomes dynamic support.
MA 50 forms a flat channel near the price indicating a sideways market. And the RSI indicator shows a value of 46, which means the price is below the downtrend level.