Reporting from WSJ, CPI rose 0.4% in March and 3.5% annually. Economists had expected 0.3% and 3.4%. Core CPI, which strips out volatile food and energy categories, rose 0.4% from February, topping expectations of 0.3%. Inflation was also higher than expected in January and February.
Fed officials agreed last month that they were prepared to keep interest rates at current levels for longer than anticipated if inflation proved stubborn, according to minutes from their March meeting released yesterday.
CPI which is higher than forecast causes the USD to strengthen and the crypto market is under pressure. Elsewhere, gold prices are also correcting, the EURUSD pair also appears to be mired with a strong bearish long body.
Bitcoin/USD technical analysis
Today Bitcoin is trying to recover after yesterday's decline, there appears to be an increase of 1% in 24 hours. Today's Fear and Greed index shows a value of 75, the market is Greed even though it is down 1 point from the previous 76.
Today's Bitcoin price is moving in the range of Low 67,570.0 and High 70,128.0.
Investing's summary of technical indicators and several moving averages in the hourly period today produced a strong buy signal with the technical indicators being very buy and the moving average also being very buy.

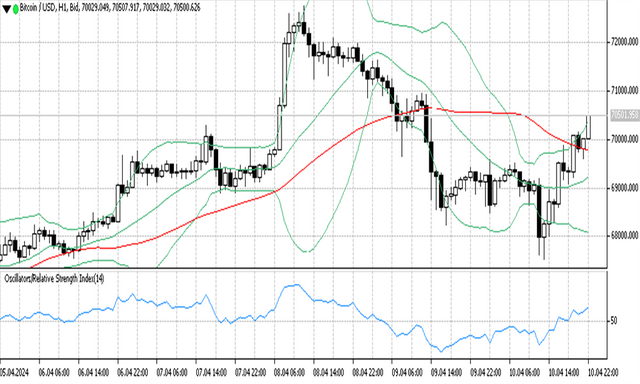
On Ticktrader Bitcoin price appears to be crossing the middle band line from the downside. The price now moves slightly above the middle band line and forms a bullish candlestick with a shadow at the bottom of the candle.
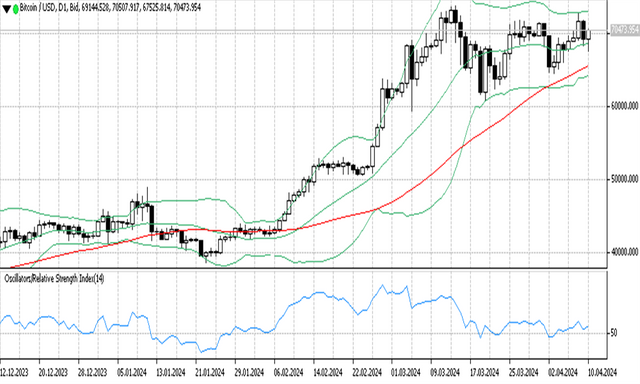
The Bollinger band line on the daily timeframe forms a flat channel with a slightly narrowed band indicating a sideways market with reduced volatility.
MA 50 is still forming an upward channel above the lower band line indicating an uptrend market.
The RSI indicator shows level 54, meaning the price is moving above the uptrend level.

On the H1 timeframe, prices appear to be rallying. After breaking the middle band line, the MA line was successfully broken, indicating a strong uptrend.
Expanding Bollinger bands indicate increasing volatility. Meanwhile, the 50 MA below the price forms a slight downward channel. MA is a lagging indicator that gives signals after a trend is formed.
Meanwhile, the RSI indicator shows level 57, which means the price is moving above the uptrend level.
Support and resistance
S3: 69277.7
S2: 69512
S1: 69659.4
PP: 69893.7
R1: 70041.1
R2: 70275.4
R3: 70422.8