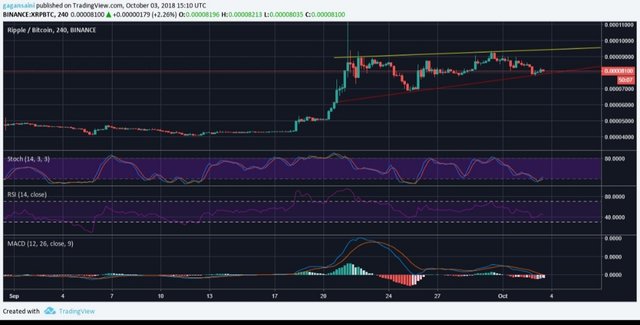
XRP forming Rising Wedge Pattern....... MACD Histogram represent you can Buy...... STOCH up which Reprersents Buy....... RSI Below 50 and little down represents and neutral indicator we can get from RSI. overall you can take entry sell at 9000 SATs targets https://www.tradingview.com/x/2cFCAuJN/

Authors get paid when people like you upvote their post.
If you enjoyed what you read here, create your account today and start earning FREE STEEM!
If you enjoyed what you read here, create your account today and start earning FREE STEEM!