
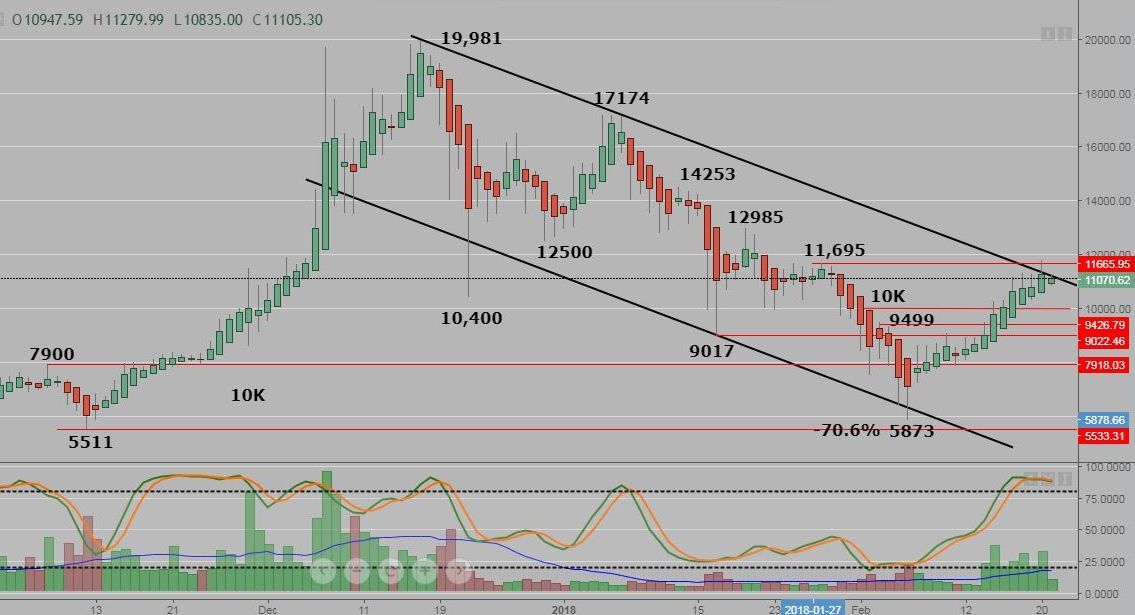
Hello all, here is a review of the BTC charts and related data. The daily chart has printed quite a few green Heikin Ashi bars since the spike low bottom on Feb 6th.
You can see much higher volume which suggests buyer conviction. There was also a mystery buyer of $400 MILLION around Feb 18/19th, someone has confidence that BTC will be going up this year...
It has reached the upper trend line which has provided a bit of resistance.
Stochastics are overbought and are embedded, all bullish signs for BTC.
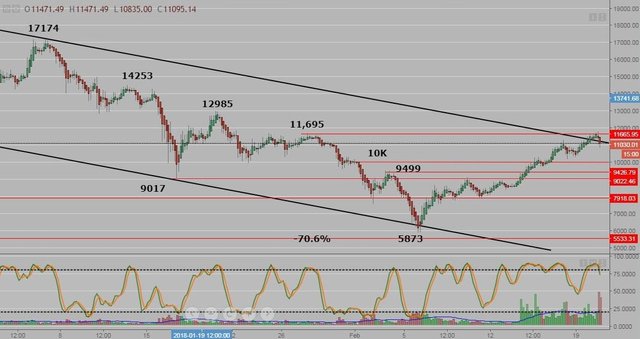
On the 4 hour chart, BTC has pierced the trend line and to the 11,695 level on GDAX and has pulled back.
It either gains support or heads back down to the 10K support level from here.
If it does break out and over the trend line, look for one bullish market going forward, a volatile one.
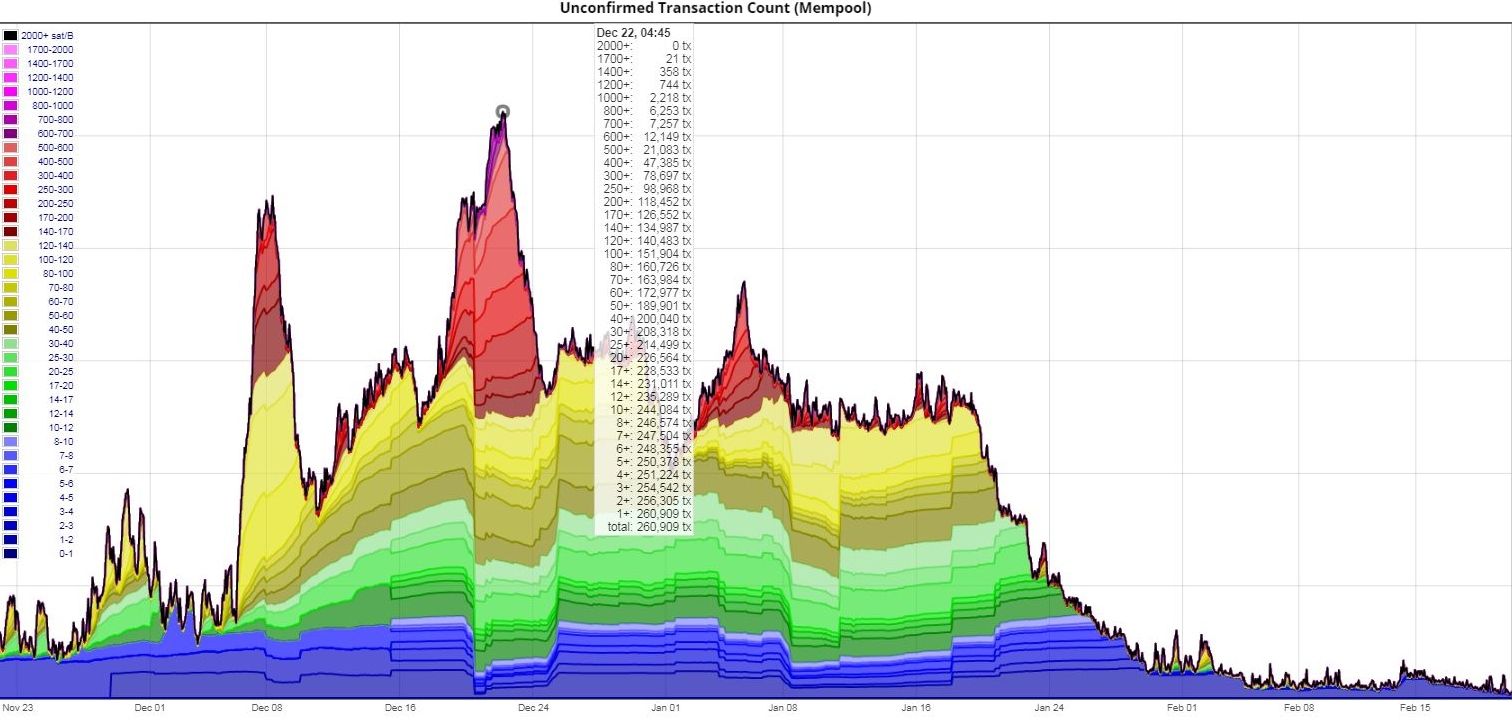
A 3 month view at the mempool, (unconfirmed BTC transactions) which has been at it's lowest level in months. The spike high was last December on the 22nd.
A 3 month chart of the average BTC transaction fee, it is currently at $3. On December 22nd, it was $55.....the same day that the mempool was at it's highest level.

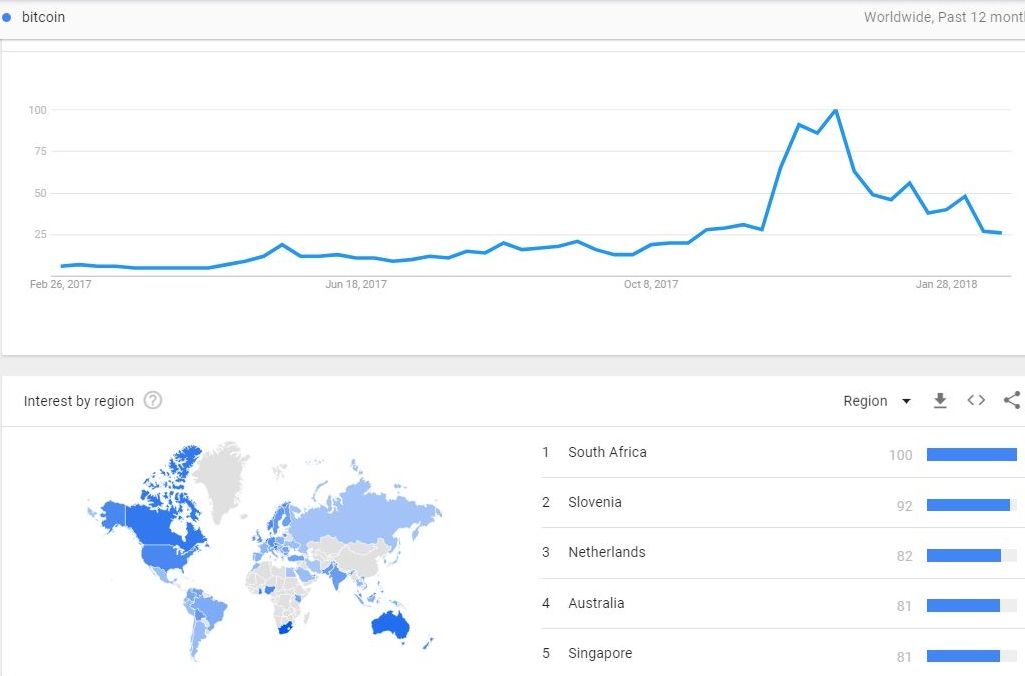
Google trends search for Bitcoin has headed south with the price. No surprise here huh? What is a little surprising is that South Africa is leading the searches...
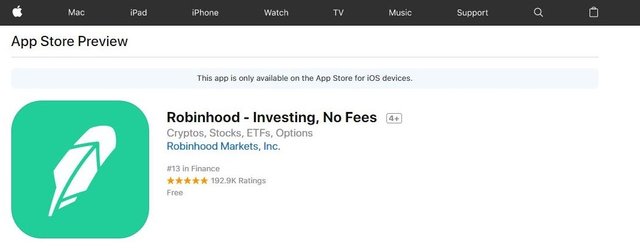
Here is a little tip for some, there is a app called Robinhood which has free trades on the conventional exchanges and will be executing them for the cryptomarket in the future. Who doesn't want free crypto trades??? Blocktrades, Bittrex, Coinbase, Gemini, etc......Watch OUT!!!
Screen shot of the app from the Apple app store:
And a few BTC headlines, there is always something new everyday...


The best place to come to for over all useful BTC relevant and current information.....Doing good.
Downvoting a post can decrease pending rewards and make it less visible. Common reasons:
Submit
Glad you like the content, thanks for visiting!
Downvoting a post can decrease pending rewards and make it less visible. Common reasons:
Submit
I like a bullish volatile market, let's go bro!!!!!!
Downvoting a post can decrease pending rewards and make it less visible. Common reasons:
Submit
We came within $28 of $12000, but as expected we are pulling back. Good news is we have some new buyers at $10,400 (green arrow) which should get us pass the $12000 level, with the next target at $17000.

Downvoting a post can decrease pending rewards and make it less visible. Common reasons:
Submit
I agree / speculate the 10.4K should be support, never really know though until it gets there. If it is going to continue to produce higher lows, it should not drop below 10.4k
Downvoting a post can decrease pending rewards and make it less visible. Common reasons:
Submit
hey..your.post so good.and informative thanks for.sharing..
Downvoting a post can decrease pending rewards and make it less visible. Common reasons:
Submit
Thank you so much for posting useful information. Bitcoin to the moon.
Downvoting a post can decrease pending rewards and make it less visible. Common reasons:
Submit
Thanks for this information, This is very helpful and useful for the readers of your posts.
Downvoting a post can decrease pending rewards and make it less visible. Common reasons:
Submit
what is the conclusion? is BTC is best opportunity for investment for now or more wait.
Downvoting a post can decrease pending rewards and make it less visible. Common reasons:
Submit
I am not a registered investment advisor, so I cannot give buy or sell recommendations. I just review the charts and post what I see regarding price trends. But IMO, the low for BTC was on Feb 6th, 2018. Most smart money already bought and took long term positions around the 6-7K level.
Downvoting a post can decrease pending rewards and make it less visible. Common reasons:
Submit
This post has received gratitude of 3.45 % from @appreciator thanks to: @glennolua.
Downvoting a post can decrease pending rewards and make it less visible. Common reasons:
Submit
You got a 2.39% upvote from @postpromoter courtesy of @glennolua!
Want to promote your posts too? Check out the Steem Bot Tracker website for more info. If you would like to support the development of @postpromoter and the bot tracker please vote for @yabapmatt for witness!
Downvoting a post can decrease pending rewards and make it less visible. Common reasons:
Submit
You got a 2.68% upvote from @buildawhale courtesy of @glennolua!
If you believe this post is spam or abuse, please report it to our Discord #abuse channel.
If you want to support our Curation Digest or our Spam & Abuse prevention efforts, please vote @themarkymark as witness.
Downvoting a post can decrease pending rewards and make it less visible. Common reasons:
Submit