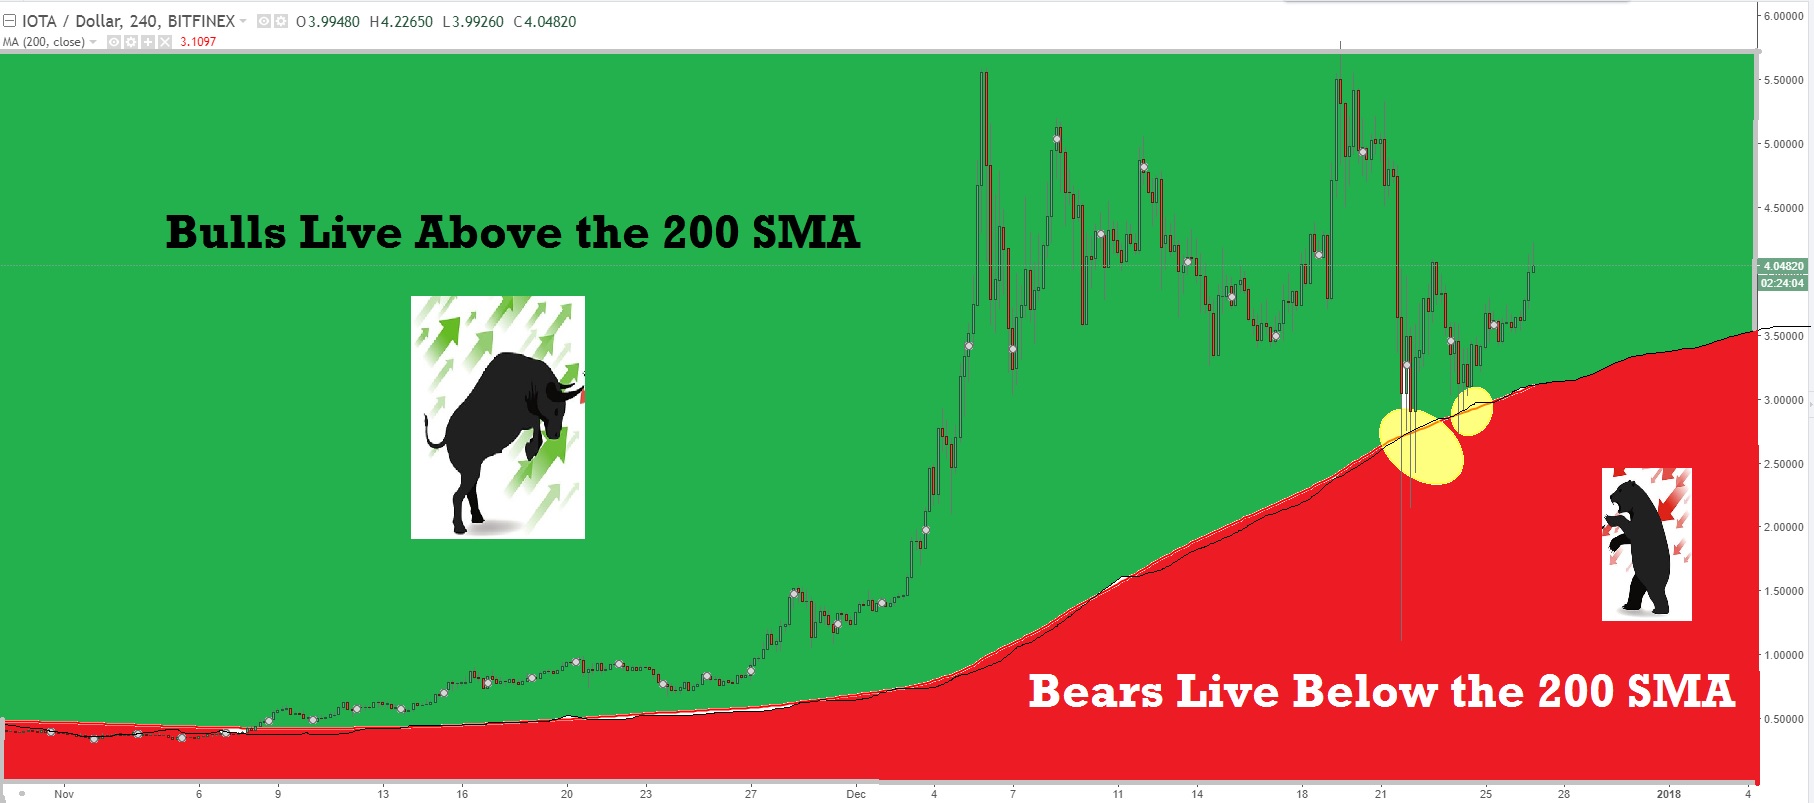
Knowing where the bulls and bears live on a price chart can help you find the strongest winning trends.
For those of you new to trading and are getting burned out on the hot trading tips and "pump and dump" in the market it pays to learn a few things about crypto and Forex price charts in order to forecast where price is going.
Simply put, you can add one indicator to your chart that can act like a compass or an alert to tell you when to to get in and when to get out.
Using an indicator called a Moving Average, investors can identify when a crypto is in the "Buy Zone" or when a crypto is in a "Sell Zone"

Well here's a key--Get your pen and paper out guys and gals;
- Bull trends live above the 200 Simple Moving Average (SMA)
- Bear Trends live below the 200 Simple Moving Average (SMA)
Here is a chart of Iota. Notice how it is trading above the 200 simple moving average in the bull zone. Buying or being long would be best. Notice how when IOTA fell, it bounced off of the 200 SMA. Buyers stepped in as the 200 Simple Moving average is the most widely watched Technical Analysis indicator.

The recent drop in IOTA was stopped by 200 SMA, then bounced up
There is one more indicator that traders use to determine strength that I will show you in upcoming posts.
Thanks for the upvotes and comments!
Happy Trading
Greg