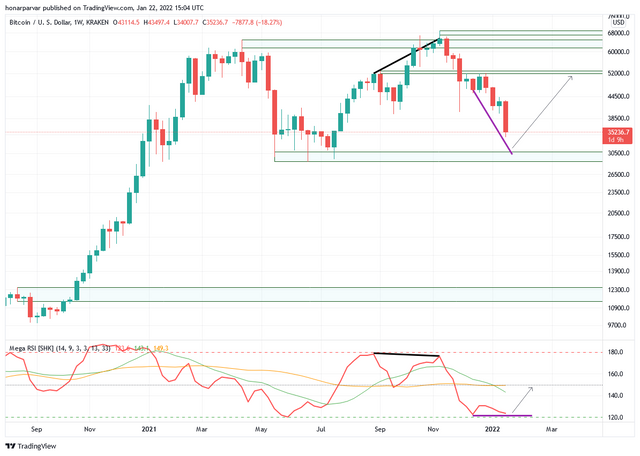
ofcourse in my trading system I mean!
I will explain my system, strategy and in the end, possible levels for reversal.

my system:
Daily and weekly chart,
price and Composite RSI index
My strategy:
simply divergence in multi timeframes

I see the divergence in higher timeframe and look for its confirmation in candle break outs + lower timeframe
how bitcoin started to drop?
the black lines on price and indicator show a bearish regular divergence which triggered at $59K and still continues.
now the scenario for Bitcoin trend reversal:
the purple lives describe a possible
how a regular/exaggerated bullish divergence may form.
when we have the higher probability of such divergence?
when a dip forms in the indicator.
when it gets confirmed?
the next candle (after the dip) engulfs the previous candle and the daily timeframe shows a confirmed bullish divergence.
what levels are proper for reversal:
28800-30800 is a proper level for reversal.
because if we lose this level the probability of div will fade away!
below that level, the market needs to gain momentum for another reversal.