Bitcoin (BTC) has pulled back from an 11-day high, but the short-term outlook remains bullish, the technical studies indicate.
The leading cryptocurrency looked overbought yesterday, as per short-duration indicators, having rallied to $6,681 on Bitfinex on Monday - the highest level since June 22.
Consequently, BTC fell back to $6,414 earlier today and was last seen trading at $6,530 - down 2.2 percent on a 24-hour basis.
Clearly, the bullish momentum has waned in the last 24 hours, still, the technical charts are biased to the bulls. Further, the probability of BTC rallying to $7,000 (psychological hurdle) remains high while prices are holding above the former resistance-turned-support of $6,341, as seen in the chart below.
4-hour chart

BTC breached the double bottom neckline resistance of $6,341 on Saturday, confirming a short-term bullish reversal and opening doors to $6,927 (target as per the measured height method). Further, it built a nice base (marked by a circle) around $6,341 before staging a high volume rally to $6,681 on Sunday.
Clearly, $6,341 is a strong support and only a break below that level would weaken the bull case.
Currently, BTC is trading well above the neckline support and is looking northwards as indicated by the double bottom breakout and bull flag breakout.
Daily chart

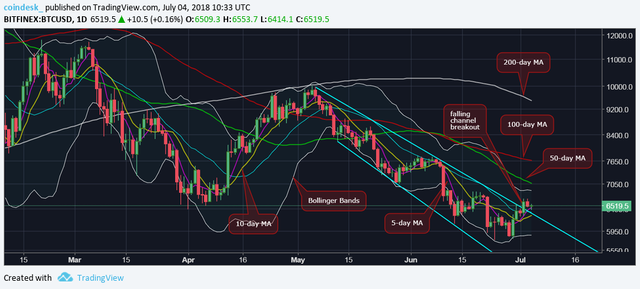
The falling channel breakout and the bullish crossover between the 5-day and 10-day moving average (MA) indicate the rally from the June 24 low of $6,755 is likely to continue in the days ahead.
On the way higher, BTC may encounter resistance at (June 19 high), $6,880 (upper Bollinger Band), $7,067 (50-day MA).
View
Sniper scope via Shutterstock
Hi! I am a robot. I just upvoted you! I found similar content that readers might be interested in:
https://www.bit-cointalk.com/2018/07/04/bitcoin-still-bullish-despite-price-pullback/
Downvoting a post can decrease pending rewards and make it less visible. Common reasons:
Submit