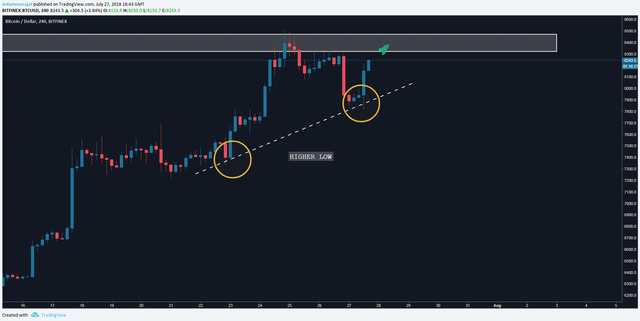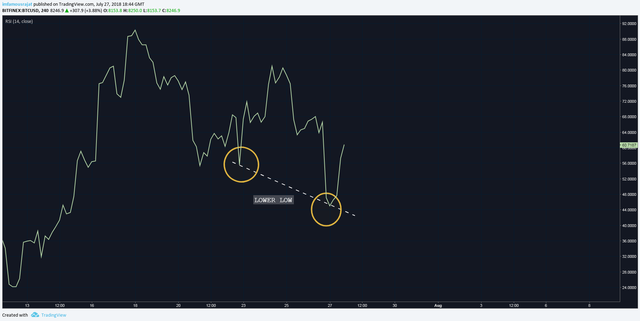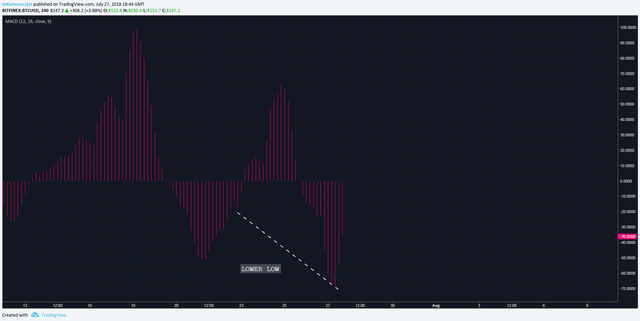
Hidden Bullish Divergence has been spotted on BTC USD chart.
For those who don't know about it, hidden bullish divergence Indicates underlying strength.
It occurs during a correction in an uptrend when the oscillator makes a lower low while the price action makes a higher low. This indicates that there is still strength in the uptrend and that the correction is merely profit taking rather than the emergence of strong selling and is thus unlikely to be last long.
Thus, the uptrend can be expected to resume.
TIME FRAME: 4H
PRICE: HIGHER LOW
OSCILLATORS: LOWER LOW


I am expecting a good Bullish movement soon. And with expiration of CME quarterly contract, it becomes imminent for BTC to rise soon.
This is just a small update so that you guys can keep an eye out this.
P.S: This is not an investment advice. This is for learning purposes only. This is my personal journal. Invest your capital at your own risk.
Keep an eye out. Trade safely. Always remember, money not lost is also a profit.
Good luck trading.!
Peace.
Hi! I am a robot. I just upvoted you! I found similar content that readers might be interested in:
http://www.chart-formations.com/indicators/divergence.aspx
Downvoting a post can decrease pending rewards and make it less visible. Common reasons:
Submit
Congratulations @imfamousrajat! You have completed the following achievement on Steemit and have been rewarded with new badge(s) :
Click on the badge to view your Board of Honor.
If you no longer want to receive notifications, reply to this comment with the word
STOPDownvoting a post can decrease pending rewards and make it less visible. Common reasons:
Submit