BTC / USD
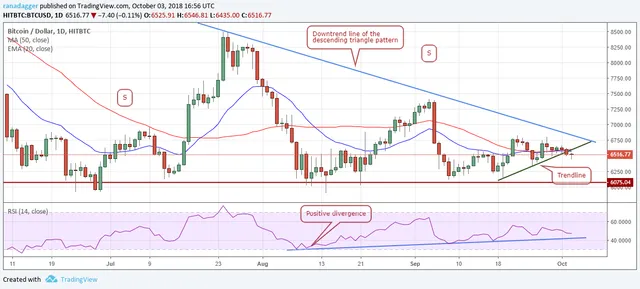
Bitcoin has been broken down by moving averages and small trend line support. This shows that sellers have the advantage in the short term. However, if the bulls manage to escalate the price above the trend line and moving averages, it will indicate demand at lower levels.
The longer the price remains below the downward trend line of the descending triangle and the moving averages, the greater the chances of retesting the critical support zone at $ 5900 - $ 6075.

A break of the bearish trend line and $ 6831.99 may push the pair to $ 7400, which in turn could act as a strong resistance.
We expect the BTC / USD pair to make a decisive move next week. As the price is close to our purchase levels, we suggest that traders keep long positions with stops at $ 5900.