BTC / USD
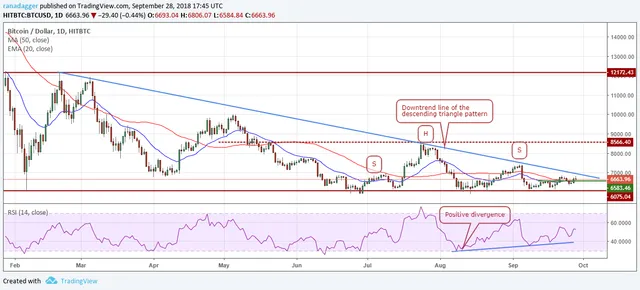
Bitcoin escaped the moving averages, but faces resistance at the intraday peak on September 22 of $ 6831.99. The downward trend line of the downward triangle is just above this level at $ 6930. We expect bassists to mount strong resistance in this area.
BTC / USD
If the bulls manage to get out of the bearish trend line, a move to $ 7413.46 is possible. We anticipate a strong episode of short coverage if this level is scaled. Therefore, traders can maintain their long positions with stops at $ 5900.
On the downside, the supports are at $ 6583.46 and $ 6341. If these supports weaken, a new test of the critical support area of $ 5900- $ 6075 is likely.
Currently, both moving averages are flat and the RSI is close to the neutral zone, suggesting short-term consolidation. The next upward directional movement will begin after the BTC / USD pair remains above $ 6930.

ETH / USD
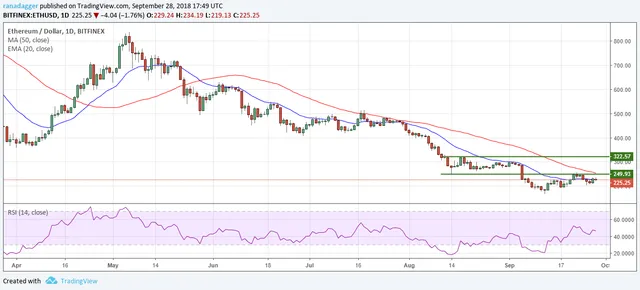
The bulls have remained at the $ 200 level for the past three days, but are struggling to raise the price above the 20-day EMA. If this resistance is crossed, the next important resistance is the 50-day SMA. Ethereum has not exceeded the 50-day SMA since May 24, therefore, this becomes an important level upwards.
ETH / USD
If the ETH / USD pair remains above the 50-day SMA, a rebound to $ 322 is likely. Aggressive traders can try this trade in a breakdown exceeding $ 255.
On the downside, the support levels are $ 200 and $ 192.5. The bearish trend will resume if the bearish slide below the September 12 low of $ 167.32.

Congratulations @jesusdr! You have completed the following achievement on the Steem blockchain and have been rewarded with new badge(s) :
Click on the badge to view your Board of Honor.
If you no longer want to receive notifications, reply to this comment with the word
STOPDo not miss the last post from @steemitboard:
Downvoting a post can decrease pending rewards and make it less visible. Common reasons:
Submit