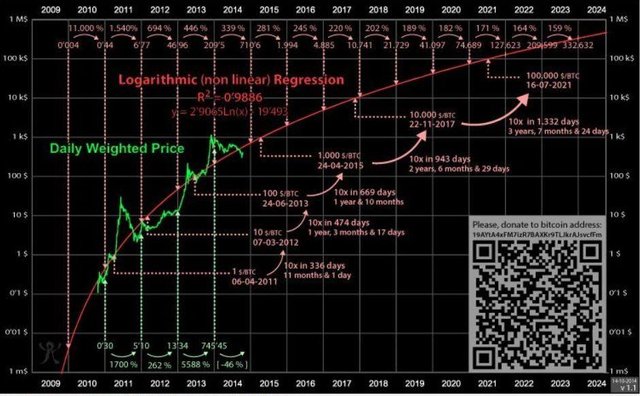
I finally got to upgrade this picture. It has been around for quite some time and recently gained some traction. This is an incredible chart made in 2014. The guy who made this calculated in the basic supply and demand curve, as bitcoin will have released all its 21 million coins in 2040. He was pretty accurate with the other data too, which is crazy. Who in 2014 would've thought bitcoin could be worth $8000 by now?
Recent tweet from bitcoin wiz:
"Chart from fall 2014, when bitcoin was $300, predicted price of $10k for today -- Nov 22nd, 2017. We're at $8,000. Next milestone on chart: $100k in summer 2021"
-- Tuur Demeester
sidenote: the address on the chart is not mine and I don't know whose it is. Someone might have re-released the chart with his/her address on it.
300$. Very crazy
Downvoting a post can decrease pending rewards and make it less visible. Common reasons:
Submit
Congratulations @jonasbostoen! You have completed some achievement on Steemit and have been rewarded with new badge(s) :
Click on any badge to view your own Board of Honor on SteemitBoard.
For more information about SteemitBoard, click here
If you no longer want to receive notifications, reply to this comment with the word
STOPDownvoting a post can decrease pending rewards and make it less visible. Common reasons:
Submit