MY RECORDE CHART OF BIT
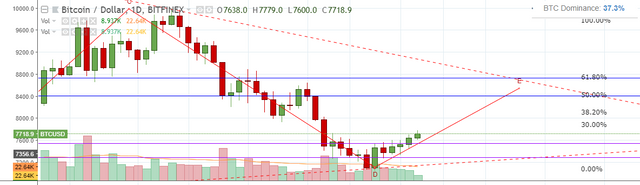
DAILY
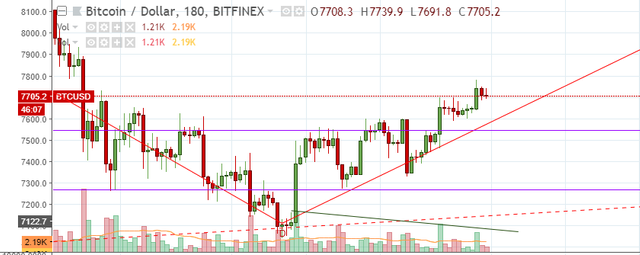
THREE HOURLY
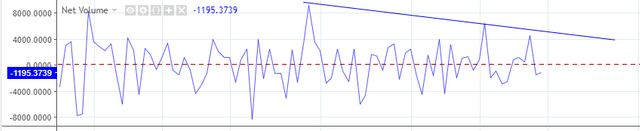
can see that buying volume is goin' lower when price is raised higher
it's closed to get falling and need to check where line will be supporting the falling
upper purple line which make possibility more than lower line to raise price to blue line