High: $6284.05USDLow: $6243.53 USDMajor Resistance Level: $6,600 USDHourly MACD: Placed slightly in the sell zone with range bound movement predominantly.Chart courtesy of tradingview.com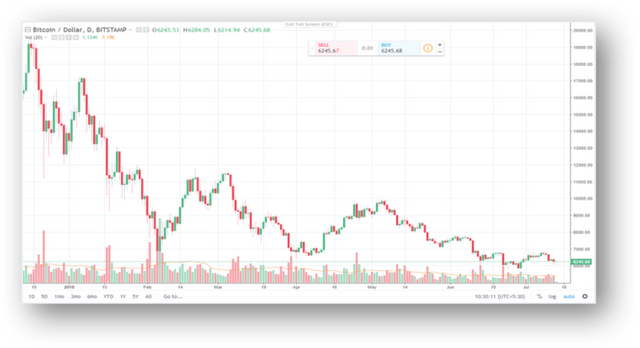
Authors get paid when people like you upvote their post.
If you enjoyed what you read here, create your account today and start earning FREE STEEM!
If you enjoyed what you read here, create your account today and start earning FREE STEEM!