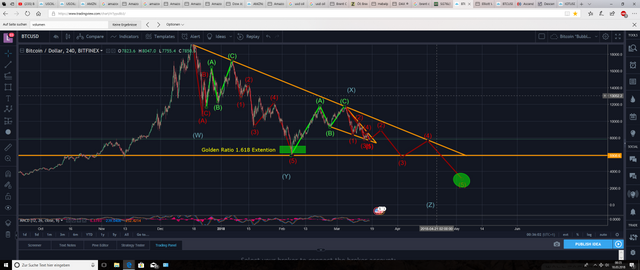
I did a new Chart for Bitcoin. I try to Analyse it due to Eliot Waves W,X,Y,X.Z Combo. The Chart Looks like to make more 4 Waves down. Maybe to 2.000-3.000 USD. After This we may an other Bull Run for Bitcoin or we see a Marktet that goes sideways.
Iam still a Newcomer in traiding, i would like to read some comments. Thanks
