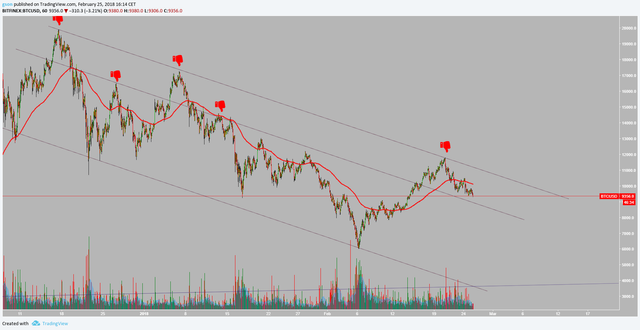
Taking a look at $btc 1hr chart.
-Market Bias short term = Bearish.

Coming from a bounce at 6000usd hitting a high of 11800usd, btc has been rejected at the final gate of resistance at which this bearish trend would have been concluded.
For any hope for the return of the bull, price action has to stay above our previous low/bounce zone of 6000usd.
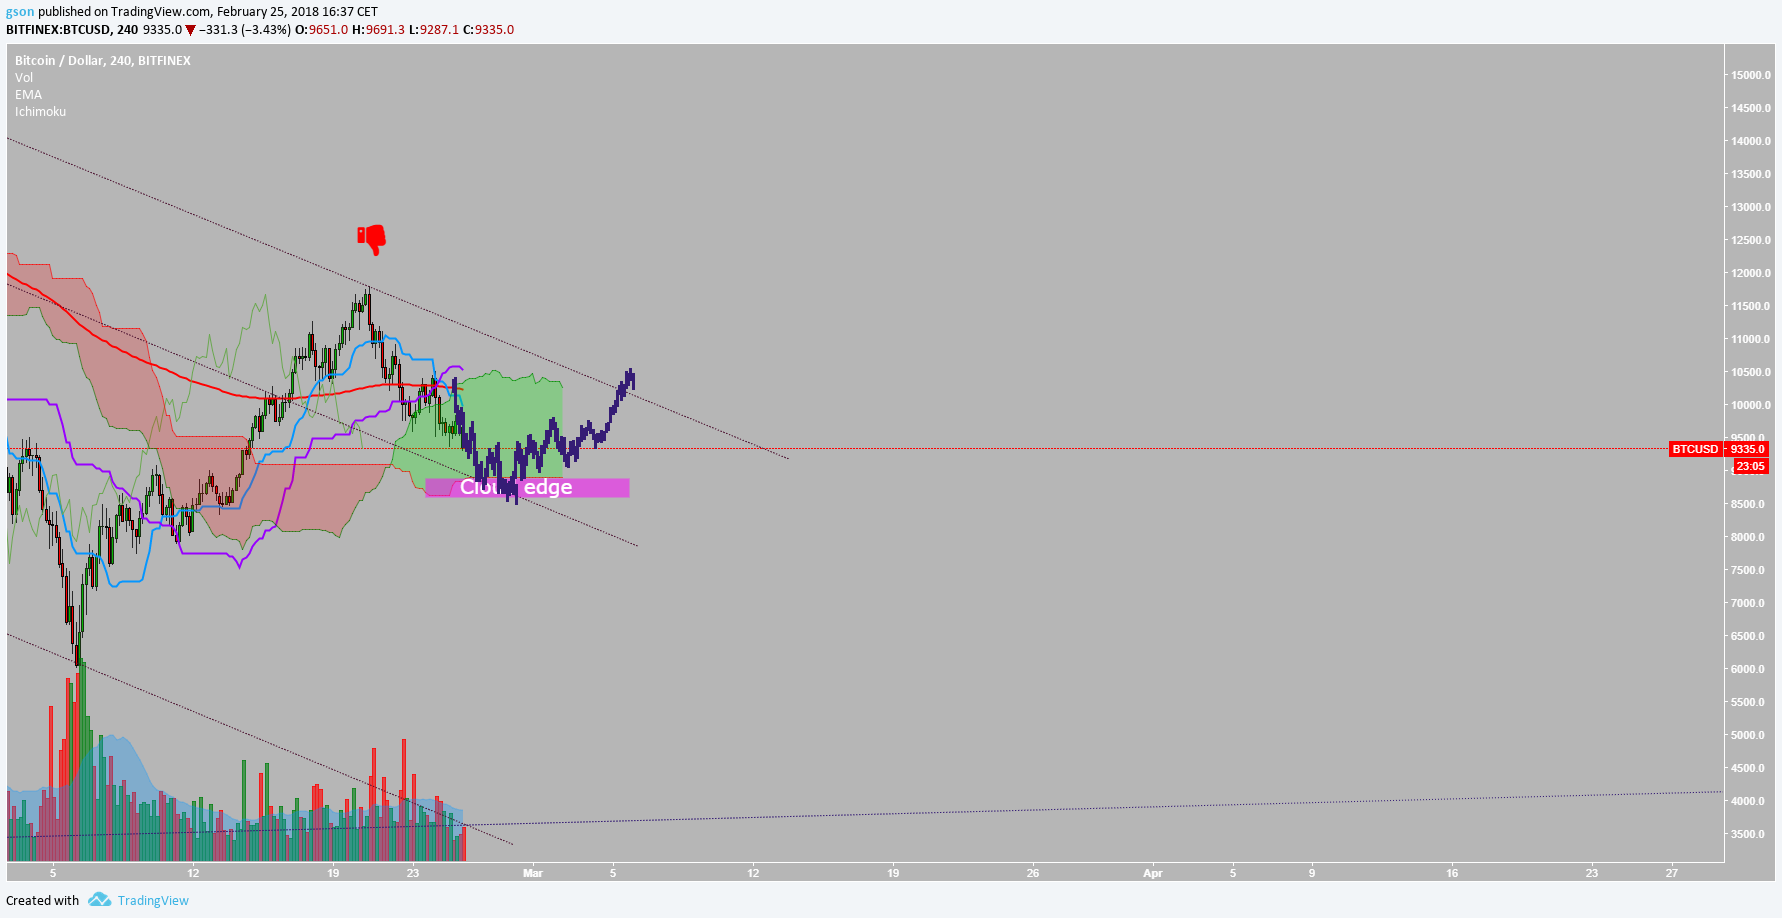
Lets have a look at 4hr for TFsupport zones..

Ideally i would like to see price stay in cloud after bouncing from cloud edge. give or take 8620usd - 8890usd and continue upwards, Ofcoarse this is trading and wishes are rarely granted.
What to look for short term for reversal signals?
.png)
My focus is on the 1Hr chart. I will be looking for a price bounce from the previous resistance trend line turned support trend line. I will be also waiting for cloud to twist green and price action above the 200 day moving average. I will then start averaging back into the market.
This is my first post so I hope it has found you well. follow me for updates in this Roller coaster market.
Congratulations @marviyoso! You have completed some achievement on Steemit and have been rewarded with new badge(s) :
Click on any badge to view your own Board of Honor on SteemitBoard.
For more information about SteemitBoard, click here
If you no longer want to receive notifications, reply to this comment with the word
STOPDownvoting a post can decrease pending rewards and make it less visible. Common reasons:
Submit