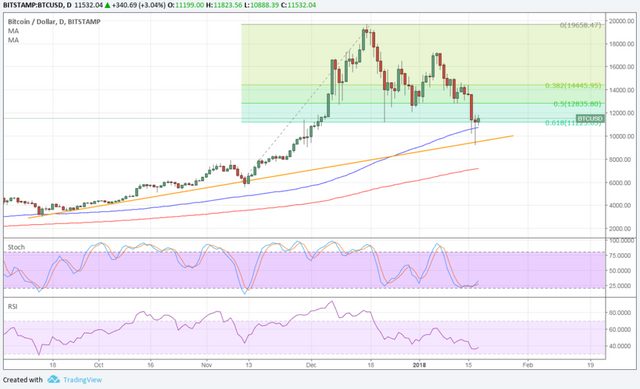
The price of Bitcoin today, Thursday, January 18, 2018, has recovered more than 6% in the last 24 hours, positioning itself above $ 11K and on the way to $ 12K. A price that has undoubtedly had a general impact on the entire market.
We could still have some correction, but I think the strongest thing is already happening, for now the market presents a "sunny day" so I want to think that we are going upwards.
Important aspects in the BTC analysis
- The price of Bitcoin seems ready to resume its rise as it found support at the long-term inflection points.
- The Bitcoin price also spun up in the ascending trend line test in the daily time frame.
- A move above 61.8% of the Fibonacci retracement level could attract more buyers to the mix.
- The price of Bitcoin found support and formed a pattern of changing candles at a major turning point, so the next daily candle closure could be crucial.
- Technical indicators used
Despite the recent strong liquidation, the simple average of 100 is above the 200-day simple average in the daily time frame. This confirms that the path of least resistance is upward and that the rise could be ready to resume.
In addition, the gap between moving averages is still widening to reflect the strengthening of the bullish momentum. The 100 SMA has also been maintained as dynamic support.
The next daily candle could close above the previous top of the spin and possibly confirm that the correction is over. From there, the price of bitcoin could reach the area of interest around $ 13,000 and a higher movement could lead to a test of maximums closer to $ 16,000.

The stochastic seems to be bottoming out and ready to rise again without touching the oversold levels, suggesting that bulls are eager to take advantage of these lower prices. However, RSI seems to have room to fall, so another fall may be in order.
Highlights in the Bitcoin price
- The price of Bitcoin seems ready to resume its rise as it found support at the long-term inflection points.
- The Bitcoin price also spun up in the ascending trend line test in the daily time frame.
- A move above 61.8% of the Fibonacci retracement level could attract more buyers to the mix.
- The price of Bitcoin found support and formed a pattern of changing candles at a major turning point, so the next daily candle closure could be crucial.
- Technical indicators of the market
Despite the recent strong liquidation, the simple average of 100 is above the 200-day simple average in the daily time frame. This confirms that the path of least resistance is upward and that the rise could be ready to resume.
In addition, the gap between moving averages is still widening to reflect the strengthening of the bullish momentum. The 100 SMA has also been maintained as dynamic support.
The next daily candle could close above the previous top of the spin and possibly confirm that the correction is over. From there, the price of Bitcoin could reach the area of interest around $ 13,000 and a higher movement could lead to a test of the maximums closer to $ 16,000.
The stochastic seems to be bottoming out and ready to rise again without touching the oversold levels, suggesting that bulls are eager to take advantage of these lower prices. However, RSI seems to have room to fall, so another fall may be in order.
Useful info thanks for sharing x
Downvoting a post can decrease pending rewards and make it less visible. Common reasons:
Submit