Trend analysis:
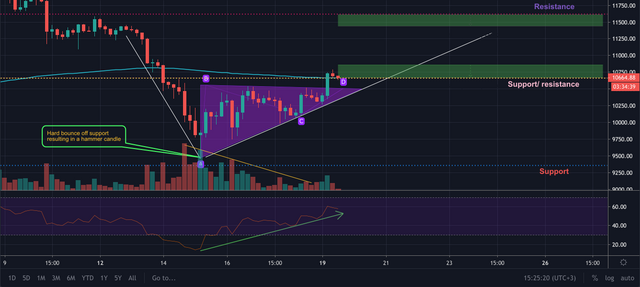
A beautiful ascending triangle formed on the 4-hour timeframe chart, which indicated a break in either direction, but it was forming more of a bullish pattern with the higher lows and the highs staying the same. The bulls took over and the price jumped above the resistance and now it could be acting as a support.
Technical notes:
The volume contracted during this triangle formation which indicated the break. The RSI is having some good momentum with recording higher highs at the moment, but still not oversold. The slow EMA(200) just caught up with the price, and now we could see a bullish crossover.
What To Consider
If the price can continue to stay above $10,650 it may reach the resistance at $11,600. If it drops below the $10,650 that means that the bears have taken over and we could continue to see further drops.
If you agree with this analysis, then Like it and visit my page! This will be the best feedback and encouragement for me!
New to trading? Are you an expert that wants to try a new platform? Try Monfex: THE ULTIMATE CRYPTOCURRENCY TRADING PLATFORM!
Did you like this article? CHECK OUT OUR BLOG for more articles like this!