Following a failure to capitalize on a recent price recovery, bitcoin could be in for another sharp sell-off, the technical charts indicate.
The cryptocurrency found a temporary low of $8,371 on March 9 and jumped above $9,000 in a convincing manner on March 11, according to CoinDesk's Bitcoin Price Index (BPI). However, the corrective rally seems to have stalled over the past few days.
The cryptocurrency has spent a better part of the last 48 hours moving in a sideways manner in the narrow range of $8,800-$9,400. As of writing, the BPI is seen at $9,095 - down 0.5 percent for the session.
Notably, trading volume has dropped more than 50 percent since March 9, possibly indicating a lack of confidence among traders in the sustainability of the corrective move higher. Should bitcoin see a decisive move above $11,700 (recent high), volumes are likely to climb.
For now, however, the price chart analysis indicates an increased risk of a sell-off to the lows seen in February.
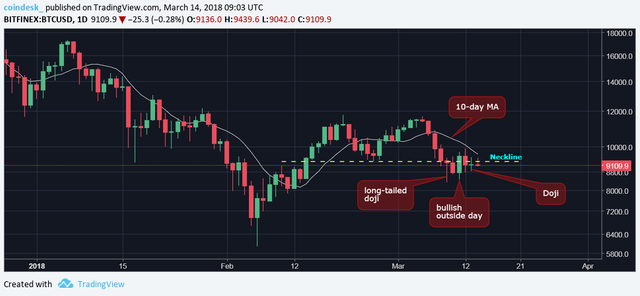
Daily chart

The above chart (prices as per Bitfinex) shows:
Despite the long-tailed doji candle and a bullish outside day reversal, bitcoin has not been able to scale the $10,000 mark. More importantly, it has repeatedly failed to hold above the double-top neckline resistance (former support) of $9,280. So, yesterday's doji candle likely shows bullish exhaustion rather than indecision in the marketplace.
Further, the 10-day moving average (MA) continues sloping downwards in favor of the bears.
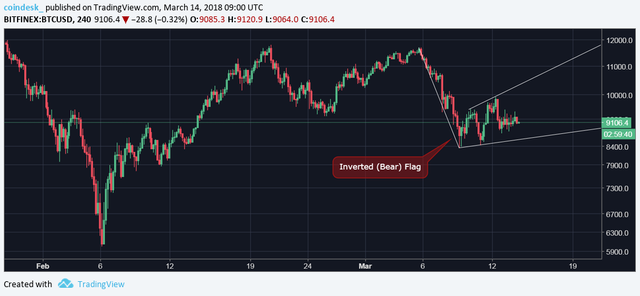
Hence, the probability of a downside break of the inverted (bear) flag pattern (seen on the 4-hour chart below) is high.
4-hour chart

A downside break of the bear flag would signal a continuation of the sell-off from the recent highs around $11,700, and could yield a drop to $5,500 (target derived by subtracting the height of the flagpole from the eventual breakdown level, i.e. flag support).
It's also worth noting that a downside break of the inverted flag would only add credence to the bearish weekly relative strength index.
View
The probability of bitcoin prices falling below $8,600 (flag support) has increased. A bear flag breakdown could open doors for a drop to $6,000 (February low) and $5,500 (bear flag breakdown target).
On the higher side, only a daily close (as per UTC) above the 10-day moving average (currently seen at $9,619) would signal bearish invalidation.
A convincing break above $11,700 (recent high) will signal a bearish-to-bullish trend change.
Hi! I am a robot. I just upvoted you! I found similar content that readers might be interested in:
https://elevenews.com/2018/03/14/bull-weakness-leaves-bitcoin-facing-further-sell-off/
Downvoting a post can decrease pending rewards and make it less visible. Common reasons:
Submit