For those of you in the crypto world, this has been a historic day indeed. Following bitcoin over the past couple months has been a trip upon a highway to hell paved upon the deck of the Titanic as it hits a flaming iceberg! However, I think that now we can FINALLY rest a little bit easier as I truly believe that this correction has found its bottom. In this post, I will do my best to prove this to you using technical analysis. If you have patience and follow along, you will find that everything lines up beautifully.
Lets start with the big picture!
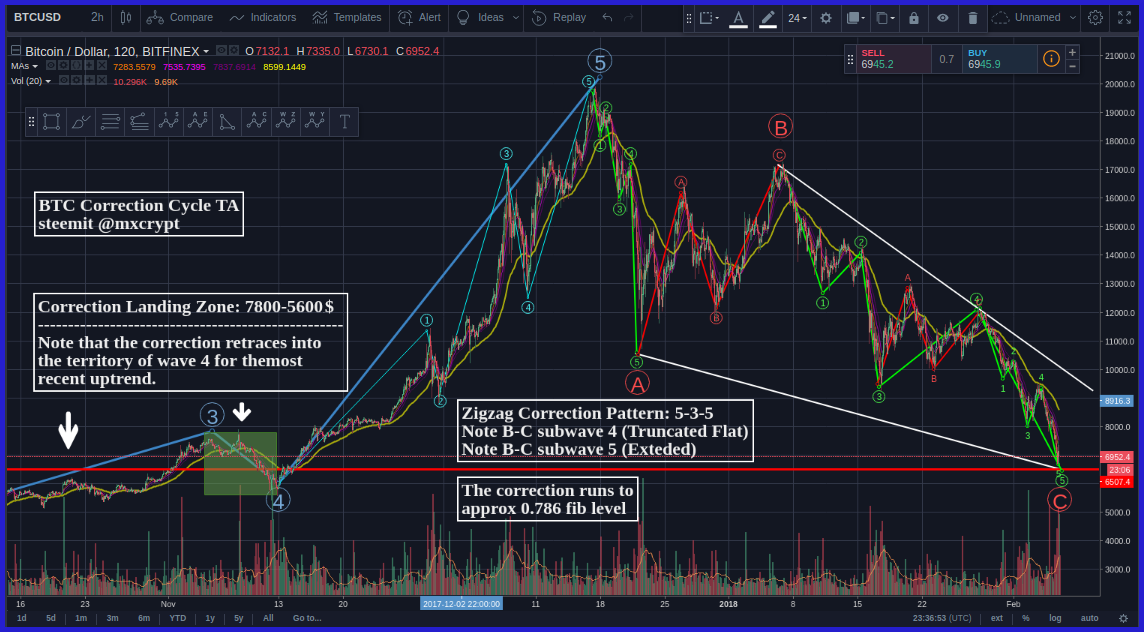
As things were going down, I kept seeing TA after TA focusing on and predicting the behavior of these last waves down. However, not many of these analyses took a step back to look at the big picture. Our journey into this correction actually began quite a long time ago. On our way up from last summer, BTC was making great strides, eventually culminating at 20k$ in a powerful series of impulse waves. In early November wave 3 reached its peak which lofted the price to nearly 8k$. This was a tremendous achievement for Bitcoin, and for cryptocurrency in general, and finally we were beginning to be taken seriously.
However midway during the month our progress into the stratosphere was arrested! It appeared that dramatic setback had hit the market, which had driven the price down to a meager 5.6k$. It was a brief but important moment as the seeds of our current destruction had been laid. According to the Elliot Wave Theory, every 1-3-5 impulse demands a correction. The theory also states that, all supports and resistances of the requisite correction are determined largely by the geometry of the impulse wave.
The Key to the Mysteries ...
Now, it is clear to me that one of the most basic tenants of Wave Theory has been overlooked by the majority of analysts (myself included). The correction should always retrace into the territory of wave 4 of the previous impulse waves. In my post yesterday, I argued for a bottom around 7.8k$. This seemed like a natural target to me, and it was well argued by many analysts that I highly respect. However, upon waking up today, I was surprised to see money still draining away from the market. The bottom had not yet come in!
Upon looking back on my previous analysis, it was clear that something basic had been missed. Suddenly, the big picture became clear to me - of course we could retrace further. 7.8k$ was only the top of the zone of the previous wave 4!! The target zone was then clear. 5.6-7.8k$ is where we should land. The average of these two numbers is about 6.7k$. Do these numbers look familiar to you??
Wave 4 is not Enough to Call the End!
Although the agreement with Wave 4 is a nice confluence with wave theory, this fact alone is not enough to call a bottom. As an analyst, I want to be absolutely convinced based on all available data that my hypothesis holds. Otherwise, I could simply be misleading myself by confirming my own biases. Worse, I could be misleading my readers, who might lose money based on my calls. Indeed, this is the most difficult part of analysis, and I feel a great amount of responsibility in this regard. Technical analysis is not something to be taken lightly.
So, let's take a look at the substructure of the correction. Upon examination, we can see that we have a 5-3-5 zigzag correction where none of the Elliot directives have been violated. On the B-C leg of the correction, we find the property of wave extension in which the subwaves themselves develop a structure. Upon looking into these substructures, we see again that none of the Elliot rules are violated. This leads me to believe that what I have shown in the figure above is a valid count of this correction.
Rock Bottom - Lets take a Look!

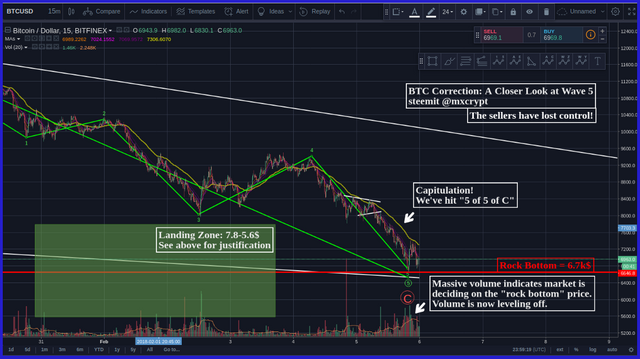
And so with brave hearts and stolid minds, let us peer into the conditions of disaster. In the figure above, I have zoomed in onto the final waves of the B-C leg of our corrective process. In particular, I want to take a look at wave (5) and note the meticulously upheld substructure of this wave. The "(Impulse) Wave 4 Landing Zone" has also been imported from the previous picture so we can see clearly how it maps into our current situation. The subwaves of this wave have also been labeled.
At the bottom of the correction, we find ourselves at the fifth subwave of the fifth wave of the B-C leg of the zigzag correction. According to all principles of TA, this should be the end of the bear market and we should be inclined to look for indications of reversal in trend to the upside. Prior to this, the price is basically in freefall looking for support. As we travel down our final subwave, we notice a massive uptick in volume around the 6.7k$ level. At this point (which corresponds nicely to our landing zone) we are undergoing a process of capitulation. At some point, the sellers will have driven the price so low and everything become too cheap. Nobody will want to sell anymore - they will have missed their opportunity to sell at a good price!
Longs and Shorts Gauge Market Sentiment
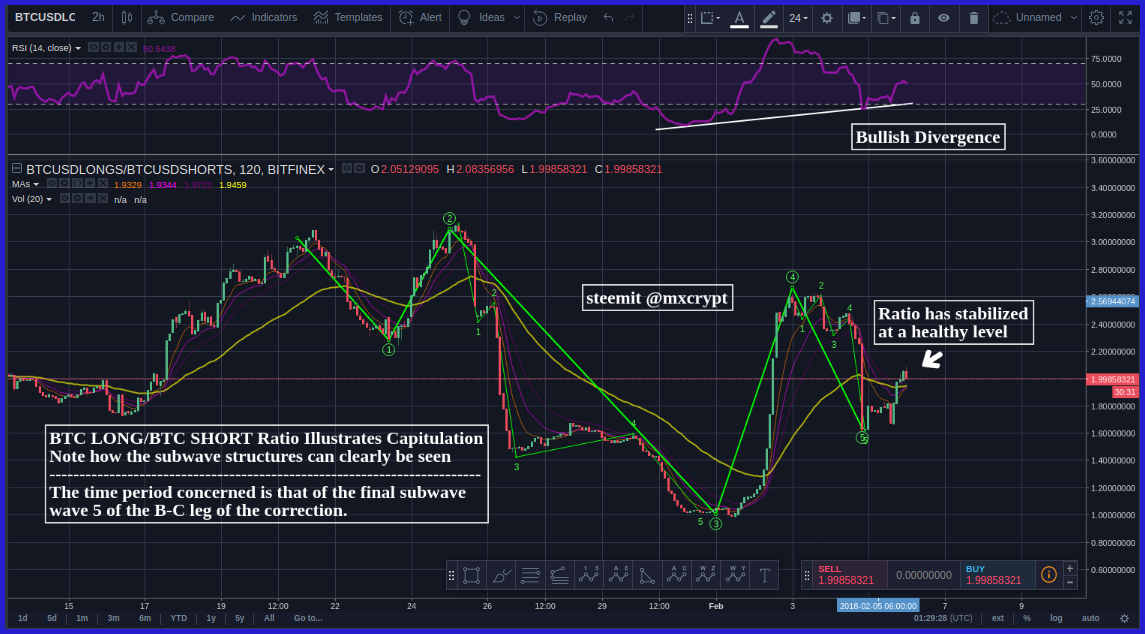
The ratio of long positions to short positions is an important gauge of market sentiment. In particular, when this ratio becomes abnormally low (i.e. particularly when this ratio drops to 1:1 and below) one can define for a process of capitulation. In the plot below, the long/short ratio is plotted for this final subwave of our zigzag correction.

In our current market, we note that the number ratio of long positions to short positions dropped steeply during subwaves 3 and 5 of the final wave. Subwave 3 brought us to my original target of 7.8k$ which was the top of our wave 4 landing zone. After a short recovery, Subwave 5 has brought us down further to the 6.4-6.7k$ range which is roughly in the middle of our projected Wave 4 Landing Zone.
This action on the ratio of short and long positions verifies that the process of capitulation is occurring, and that the market has finally corrected. The wave structure can clearly be identified on the longs/shorts ratio. Also, this indicator has since stabilized to pre-correction levels indicating that some stability is coming back into the market. Also note the higher low on the RSI of this indicator, which suggests the subtle building of bullish sentiment.
Is a Bullish Sentiment Building?
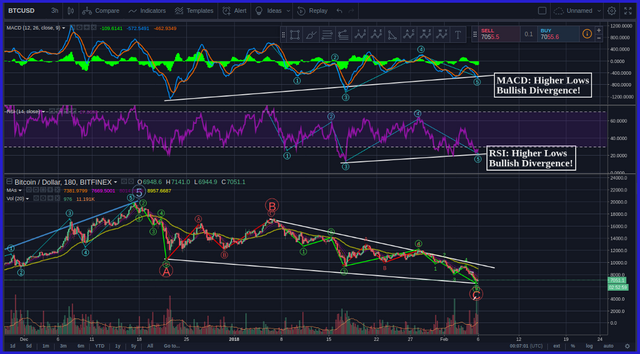
If this moment truly reflects the process of capitulation, then signs of bullish sentiment should be visible across all indicators. In addition to fancy techniques such as the long short ratio, we can examine RSI and MACD for signs of a change. These are plotted below, for the current timeframe.

Immediately, we see signs of bullish divergence on the MACD chart as indicated by the higher low. Also note that the wave structure can clearly be seen as mapping onto the MACD. Most importantly, we are starting to notice a curling upward of the MACD along with higher lows which clearly suggests a bullish sentiment. Remember though that MACD is a lagging indicator which suggests that we need a bit more time to truly confirm the trend. Interestingly, the subwave structure can also be seen on the RSI along with a similar pattern of bullish divergence (higher lows) pointing to exciting times ahead!
The Correction in Retrospect
Overall, I believe that this correction has been a very good thing for the market. Remember that corrections are a part of the additive growth process, and since our market is young and flourishing we should them to be swift and violent. Now, after a very difficult two months, a very clear picture has emerged for bitcoin. In my my view, the confluence of indicators with wave theory I have outlined here is truly magnificent for it elucidates almost every core principle of the market action with immense precision. I truly wish that you too can find beauty in this process of correction, and I hope that you have matured emotionally, psychologically, and spiritually through your experience of its movements.
Confidence 5.0/5.0
@mxcrypt
A Link to my Previous Incorrect Analysis
Standard Legal Note
These are solely my own ideas! This is by no means professional financial advice and I cannot be held accountable for any investment decisions undertaken by reading this article!
Found this helpful? Feed me some crypto!
BTC Wallet :3PPENyabp2gsEfNahLyhMsgdwtjbodrtFm
ETH Wallet :0x7792cB95e9faa8B4049c88dD0dD567Cb843bc696
LTC Wallet :MXDmNsYKccTxnyXe4vpq3XrbstHsKex9S9
Congratulations @mxcrypt! You received a personal award!
Click here to view your Board
Downvoting a post can decrease pending rewards and make it less visible. Common reasons:
Submit
Congratulations @mxcrypt! You received a personal award!
You can view your badges on your Steem Board and compare to others on the Steem Ranking
Vote for @Steemitboard as a witness to get one more award and increased upvotes!
Downvoting a post can decrease pending rewards and make it less visible. Common reasons:
Submit