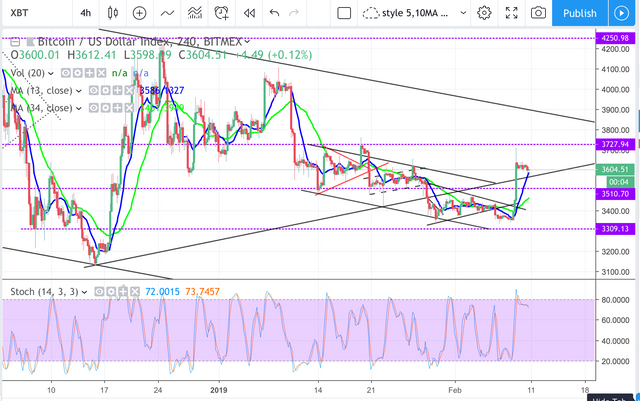
Still on consolidation toward the previous big triangle bottom around 3600 zone. Possible 2nd leg up to test big channel top resistance around 3800 zone.
News: (Current) | (Upcoming)
Short term moving average (day candle) :
RSI :
Network Value to Transactions Ratio :130
Total marketcap :120
Dominance :53.1
Bitfinex Margin Long/Short Volume Ratio :
Depth Chart : (S) | (R)
Weekly Timeframe :
Recommended
►You’re gonna post on instagram, youtube, twitter anyway, why not post and earn steem : https://share2steem.io/
►Walk, Jog, Run and Earn steem for moving : https://actifit.io
►Play and Earn steem, blockchain Trading Card Game : https://steemmonsters.com
►Sell your upvotes automatically : https://smartsteem.com
Dark Side Secrets
►Play and earn magic token dividend (revenue share with the house) : https://magic-dice.com
Sponsored ( Powered by dclick )
Published by OnePercentBetter
on


Thank you so much for participating in the Partiko Delegation Plan Round 1! We really appreciate your support! As part of the delegation benefits, we just gave you a 3.00% upvote! Together, let’s change the world!
Downvoting a post can decrease pending rewards and make it less visible. Common reasons:
Submit
Guiding me through the clouds of Ichimoku. There is a considerable resistance in 3760. Which if broken, will try the prices, which you say. Equally the Ehler Fisher indicator, in which it seems that the moving average in the short term, seems to have broken the line of 0, hopefully it will be confirmed.
Another signal, that still lacks a little, but that in a single day I advance considerably, was the MACD, indicator that today presents us an increase of the moving average in the short term, which increased from -75 to -29, was quite way, leaving much more down to the long-term moving average. I hope we get closer to the line of 0. Line that we already penetrated this year, but for a short time. And it would indicate a clear change of tendency, if we overcome it and consolidate it for several days.
It gives me some concern is the CCI, indicator that has already very high values (perhaps we are in a roof for a few days), and seem to be going off. (to go below 100, could resume the downtrend)
Regards!
Downvoting a post can decrease pending rewards and make it less visible. Common reasons:
Submit
yeah short term bounce probably till 3800 zone before heading down for consolidation again
Posted using Partiko Android
Downvoting a post can decrease pending rewards and make it less visible. Common reasons:
Submit