Bitcoin Price Analysis (9–23–2018) Potential Re-Test Before Advance

This Bitcoin Price Analysis will feature a few revelations that were not contained in the prior versions.
Please note that this is not financial advice, nor should it be construed as such. These are merely ideas.
For more information like this, please join the Telegram t.me/MerkleTrader
Bitcoin Price Analysis
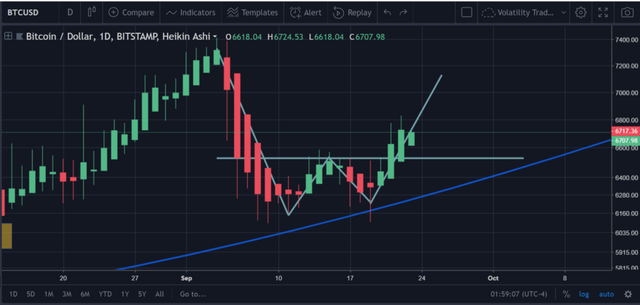
https://www.tradingview.com/x/pjQmUeYg/
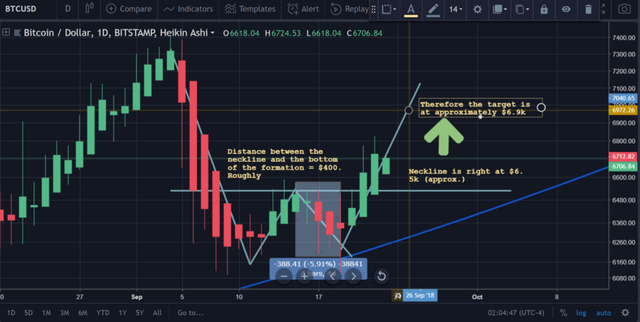
From the first picture, it should be immediately apparent that there is a Double-Bottom Chart Pattern Formation that has formulated on Bitcoin on the 1D chart.
This is symbolized by the light blue line drawing the a ‘W’ figure through the price movement on the chart above.
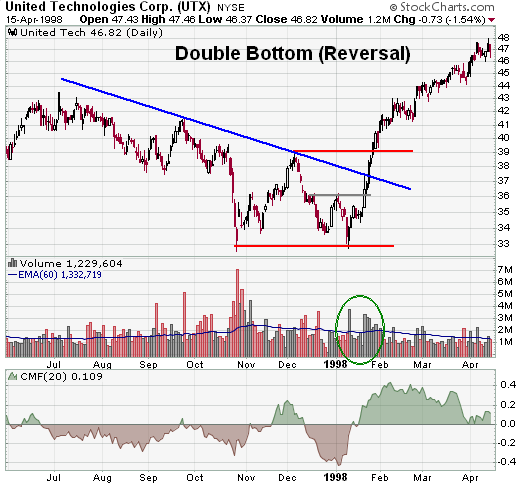
As noted in the photo above, this is a reversal pattern — which means that there must have been a prior downtrend.
On the daily, this is shown to some extent via the decline in price movement from September 5th to the completion of the pattern.
However, this can also be seen in the expeditious decline in price since May 5th to this current point as well.
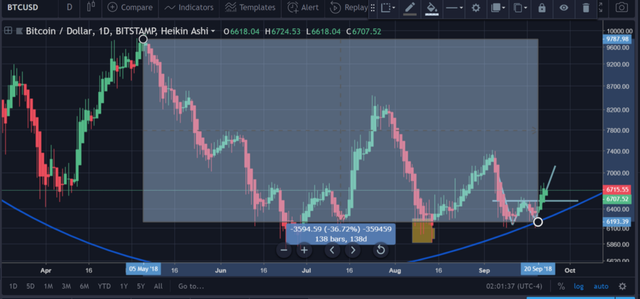
https://www.tradingview.com/x/aA7ppqvz/
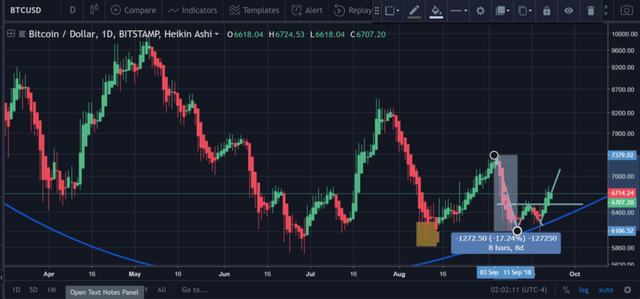
https://www.tradingview.com/x/eGxz6uMf/
Estimated Price Target From the Double-Bottom Formation
https://www.tradingview.com/x/6QLQYcSD/
The estimated target from the chart pattern formation is approximately $6.9k.
This falls in line (to some extent) with where the overhead trendline (spanning from May 5th, 2018) is currently located.
https://www.tradingview.com/x/fyofPX03/
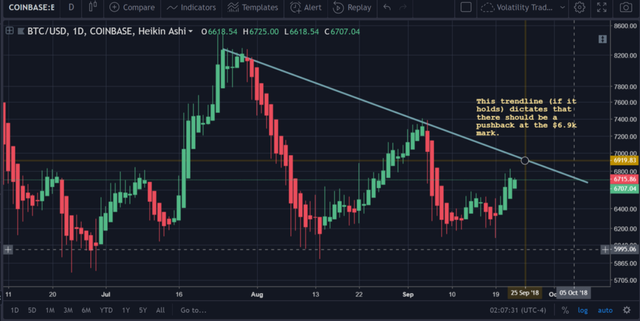
As one can see in the photo above, the trendline stemming from the price decline that started on July 28th is also telling us that $6.9k is a ‘bounce’ point.
Taking a Quick Look at Volume

https://www.tradingview.com/x/J92pOnkX/
As can be seen in the screenshot above, the volume truly isn’t doing us any favors in deciphering whether there is a general decline in the positive price volume or not.
Since this is the daily, we would more than likely need to wait a few more days before being able to make a definitive assumption about the volume trend during this slight uptick period.
However, by the time a real pattern manifests itself in the volume bars at the bottom of the chart, the future price action probably will have already played itself out. Therefore, we won’t put too much stock on waiting for more volume metrics at this point.
Possible Upside of $7.1k

https://www.tradingview.com/x/BbY2yVlN/
So, if you scroll your chart back, you should be able to draw two trendlines.
- The first trendline should be like the one that we discussed above. That one is a potential trendline, because it has only been tested twice.
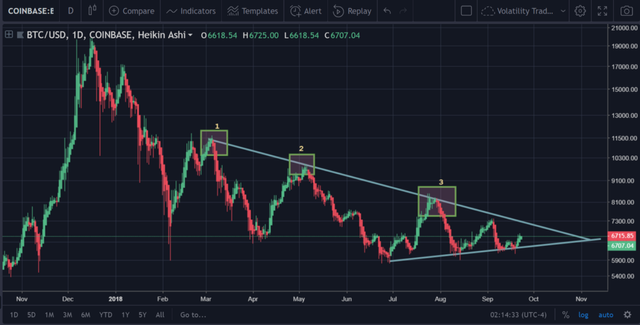
- The second trendline is one spanning back to May 5th, 2018. While it isn’t displayed in the picture above, that trendline is substantially more valid because we can identify three different times (over a decent span of time), when the trendline was hit.
https://www.tradingview.com/x/fPQPoQb2/
Due to this fact, $7.1k-$7.2k cannot be ruled out.
A break above both trendlines would signify major bullish price action, and further sustained gains on the price for Bitcoin is something that should be expected at that point.
However, for now, it is more prudent to focus on the aforementioned targets of $6.9k and $7.1k as the maximum upsides.
Relative Strength Index (14) [On the Daily]
https://www.tradingview.com/x/5ygRMXpM/
https://www.tradingview.com/x/iNODsJ8k/
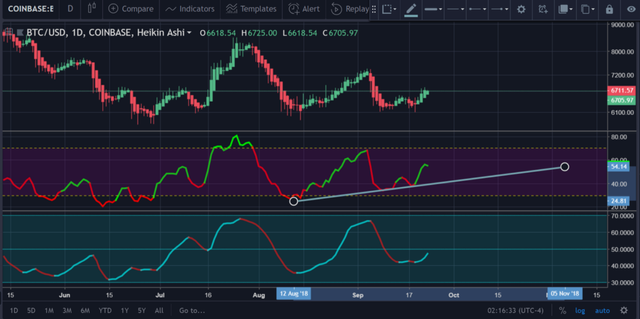
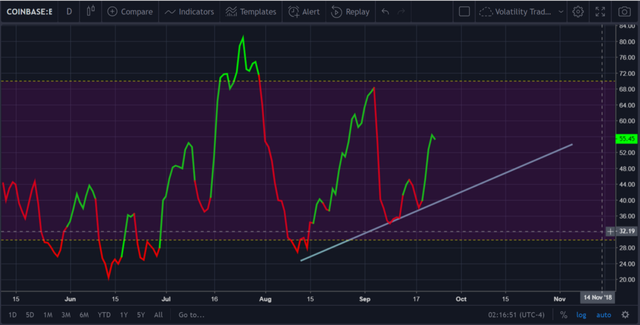
Based on the RSI(14) [Ignore the coloring; This is a custom indicator and the colors do not affect the actual wavelength of the RSI itself], we can see a noticeable ‘undercurrent’ where there have been consecutive higher lows.
That’s always a bullish sign.
We can’t call it positive divergence though, because the lows on the chart have also been higher.
Given this fact, the RSI(14) is something that we should look to in order to anticipate if there will be lower lows in the price in the future. This is because, a lower low on the RSI could be accompanied by yet another higher low on the actual chart.
If this were the case, then the lower low on the RSI chart would be a strong indicator that the price action for Bitcoin was beginning to fade and that a short position/consolidation of profits should be strongly considered.
However, at this point, neither recourse seems necessary.
Anticipating a Re-Test of $6.5k
In order to appropriately anticipate a re-test of the $6.5k point, Bitcoin must be examined on the lower time frames.
This is because this move would more than likely be something that occurs in the near-term (next few hours/day or two), and therefore, the appropriate signals notifying us that such an event is occurring probably wouldn’t show up on the daily charts.
To start off with, we’ll go ahead and check out the H4 chart.
https://www.tradingview.com/x/YIxsrGGF/
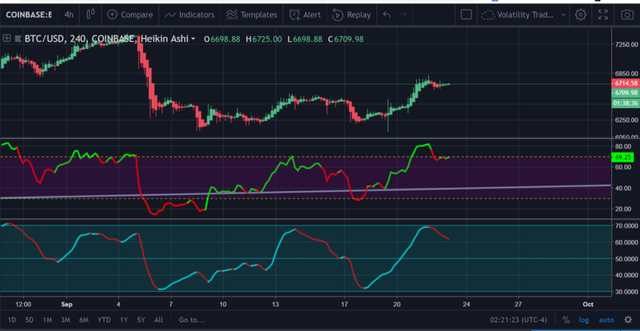
Based on the chart above, we can see that the RSI(14) has already hit the overbought point and appears to be continuing its path toward overbought territory after a slight drawback (which occurred due to the consolidation that you can see on the chart above).
From what the above indicators are displaying as well as the price action, it stands to reason that there will be a brief consolidation in price coming soon. More than likely, it will be to $6.5k as we surmised earlier in the article.
This re-test is needed for the bulls to ‘recharge’ before making their final (potentially) trounce toward the $6.8k-$7.1k legion.
If not, then it should be expected that the price will continually ascend until it is eventually pushed back down.
This would make a $6.8k/$6.9k threshold a lot more plausible than $7.1k or higher, but $6.5k should be considered the first stop down in any situation.
Conclusion
Currently, the price action for Bitcoin appears to be pretty healthy.
However:
- If someone is specifically looking to make very short-term profits, then now is probably not the best time to place a long position. A short position could also be somewhat risky since the price will more than likely have fluctuated by the time you’re reading this portion of the article (currently, its trading at $6720).
- Overall, on the daily (looking at the bigger picture), things appear to be safe for the time being. There are no major indicators that there is huge bearish sentiment that will swoop in.
As always, of course, it is prudent to watch out for any and all news that comes across the circuits. One never knows what may happen and none of us possess a crystal ball. Something fairly earth shattering would result in a major price drop or price gain that would invalidate everything stated.
As always, remain careful trading!