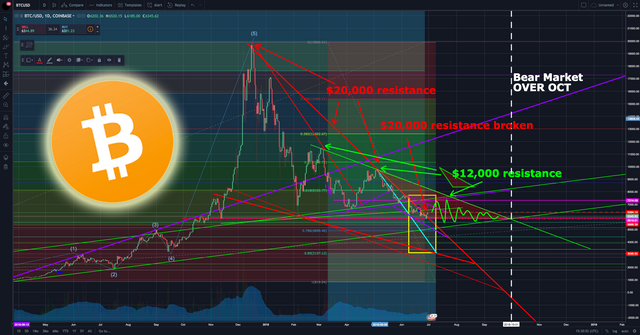
This is a chart set to Daily Candle Sticks
The downward resistance which began at $20,000 is lined in red. Today Bitcoin broke its 6 month long resistance - though this could be setting up for a bull trap.

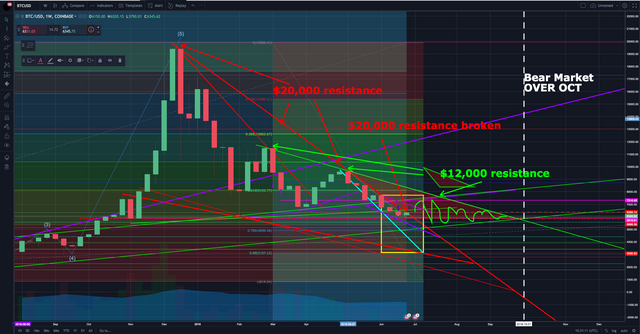
This is a chart set to Weekly Candle Sticks
There is a triangle highlighted in red which marks a secondary area of resistance which began at $12,000 lined in green.
When Bitcoin hit $20,000 it quickly retraced back to $6,500 followed by a key impulsive move upward to $12,000. This is currently where our new resistance ceiling is.
Do Not mistaken this for horizontal resistance. This is downward pressure which began at $12,000.

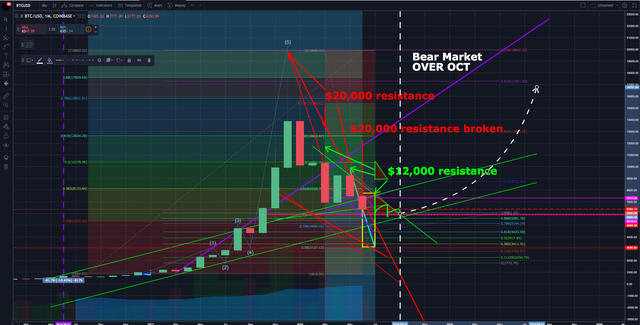
This is a chart set to Monthly Candle Sticks
Here was can see this correction likely coming to an end where we assume it will catch support within our last stable green channel, where we find waves 1, 2, 3 and the beginning of the 4th.

Time is only one aspect of resistance, we will find ourselves in the future eventually.. beyond any diagonal downward resistance, and then we must fight our way back to all time highs... and to the sky we go. A $32,000 Bitcoin is very likely when we surpass $20,000.