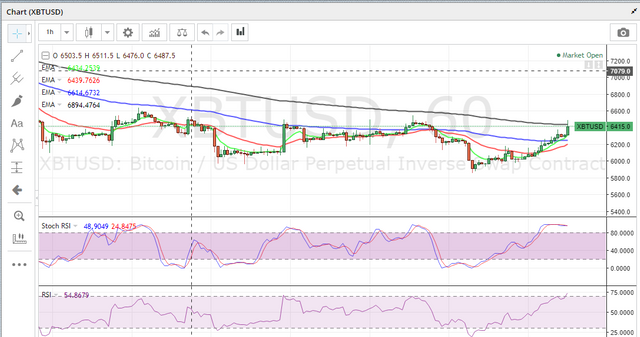
As I am writing The XBT is trading around $6415. I will try to keep it extremely simple and short on all my charts and descriptions . The more line we draw the more we confuse ourselves. So coming to The charts
XBT taking Resistance at 200 MA.
In RSI it is touching 80 and Preparing for a negative divergence.
In Stochastic RSI its preparing for a divergence as it is touching 100 .
Within 30 Hrs it moved from $5915 to $6415 without any strong reason.
All the facts indicates that a fall is suppose to happen. This is what I feel but I may go wrong. Take your own decision.
** I am not a financial adviser.!
