This article will look at the buying / selling pressure shown by the CO & bullish divergences.
The Chaikin Indicator is an oscillator (CO), which shows changes in a cryptocurrencies underlying momentum.
The CO is based created from the following calculations:
Stage 1 - Calculate the MFM (Money Flow Multiplier). Calculated through averaging H/L and closing prices. From here the calculation is then multiplied by the daily volume.
Stage 2 - Then calculate ADL (Accumulation Distribution Line) MFV x (Period - 1) + M x (Period)
Stage 3 - Final calculation of CO = (3 day EMA of ADL) - (10 day EMA of ADL)
Once you have the difference between the 3 day EMA of the ADL and the 10 day EMA of the ADL, you will have the CO line.
However unless you wish to calculate the CO yourself, you can simply click the `Chaikin Indicator´ and this is all done for you… The above information does however show you the complexity behind the CO and that it is an indicator created through indicators.
As well as providing bullish and bearish signals, the CO also demonstrates buying and selling pressure currently seen within the crypto.
Buying / selling pressure
Below we can see the buying and selling pressure of BTC between 09/12/2020 and 17/01/2021. There is a clear correlation between the CO and the increase of BTC price. During the first period the indicator is showing that BTC is being accumulated over distribution. Therefore due to the indicator increasing its value in the accumulation zone, there is increased buying pressure.
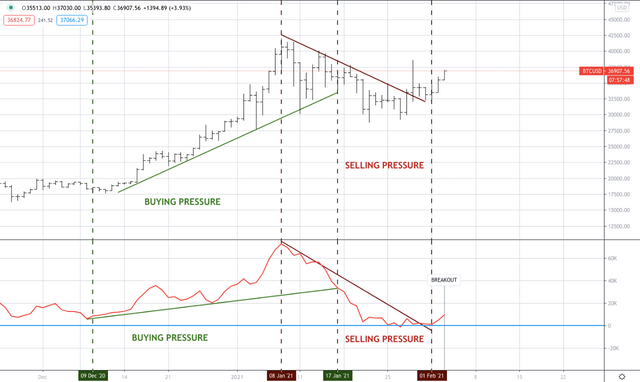
BTC/USD
However from 08/01/2021, the buying pressure hits its peak and a selling pressure trend line begins in the indicator. This showed increased selling pressure, although due to the CO line staying above the baseline BTC is still on the whole being accumulated. The increased selling pressure then ended on 01/02/21, with BTC seeing a positive breakout from the CO indicator and the overhead resistance on the price chart.
Below we can see another example of selling / buying pressure with ETH. The first period between 02/11/2020 and 21/11/2020 shows increased buying pressure with the cryptocurrency being accumulated according to the CO. However during the second period between 21/11/2020 and 23/12/2020, the indicator suggests that the cryptocurrency accumulation is decreasing therefore showing increased selling pressure.
Bullish divergences
During this period ETH decides to increase in price, even though there is selling pressure. With the price increasing and the selling pressure increasing a divergence is created.
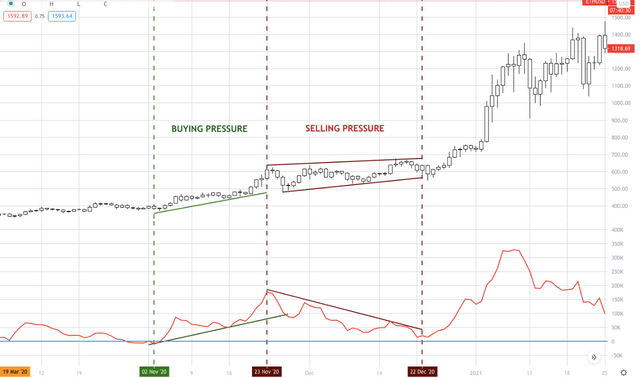
ETH/USD - CO divergence
After the selling pressure is relieved from 25/12/2020 ETH then proceeds to substantially increase in price. The significant increase in price is partially due to the CO divergence.
Below we can see the selling pressure divergence with ETH between 25/11/2020 and 23/12/2020 in more detail. The purple line shows the clear increase in price, with the CO purple arrow showing the fall of the CO line.
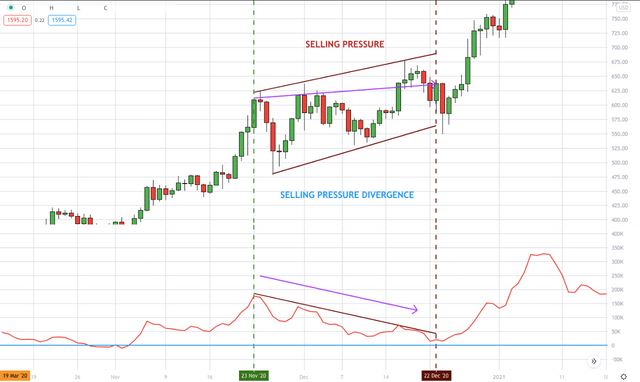
ETH/USD
Proceeding the bullish divergence was an ETH price increase of x > 100% between 22/12/2020 to 09/01/21. Therefore showing the potential price gain after a CO divergence (if the CO remains above the baseline).
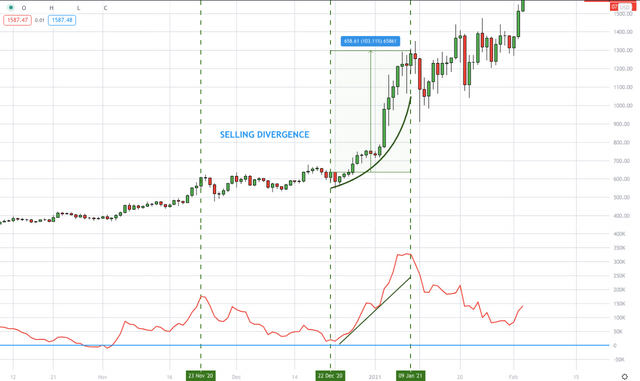
ETH/USD
Below we can see another example of a bullish CO diversion. Between 19/12/2020 to 28/12/2020 we can see that selling pressure has been applied to BTC. This was then rejected, forcing BTC higher. Price subsequently increased x<50% after the divergence.
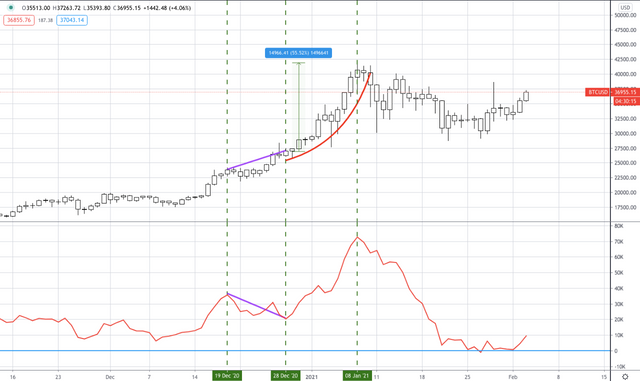
BTC/USD
Conclusion
In conclusion bullish divergences with the CO should be watched out for as they can act as potential pointers towards further price movement. While the CO displaying increased buying / selling pressure can help point towards a potential entry point when the pressure trend is broken. Alongside this the pressure can help to show the current momentum and sentiment of a cryptocurrency.
Red Tribe article 1.02
Join our free Red Tribe telegram channel for TA posting.
Red Tribe are not financial advisors and all content is for educational purposes only.