Red Tribe BTC update - TA by Oliver Page

This is not financial advice.
1hr chart
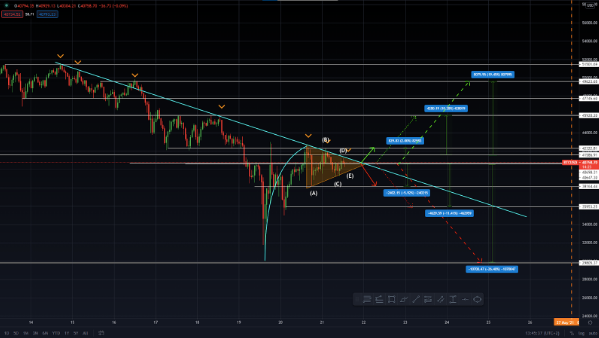
On the hourly candles we can see that BTC is currently being held back by a descending resistance. This resistance has multiple validation points as shown in the chart. When looking closer, BTC is currently moving within a symmetrical triangle fulfilling wave (E).
If we see a positive break from this descending resistance BTC should be looking at the following targets.
Bullish targets:
$42.3K
$45.9K
$49.6K
Bearish targets:
$38.1K
$35.9K
$30.0K
BTC/USD
Which breakout is most likely?
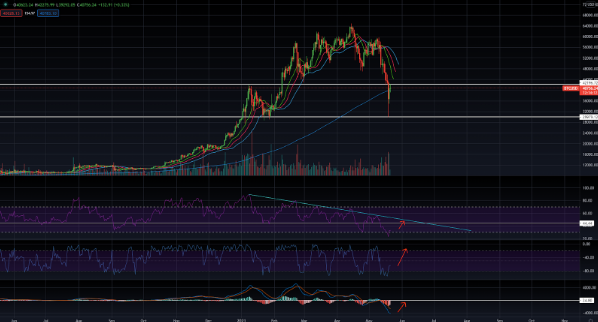
When looking at the intraday hourly chart the most likely breakout is bullish. This is due to the positive pre-trend but also factors when we look at the daily chart.
The RSI is due a pullback, likely towards the descending resistance we can see. Additionally the %R indicator is pointing towards a pull towards the upper region due to a breakout from the -80 / -100 zone. The histogram from the MACD is also showing signs of a pullback, however we will not be considering this (due to historical MACD histogram unreliability).
The positive break should lead us towards the green line from the alligator indicator.
The underlying bearish issue
The BTC contract expiry date is the first issue. Negative price action is still expected until the contracts expire. This is due to yearly contract expiry price action history (Jan, Feb, March, April).
BTC/USD daily chart
Hourly chart indicators
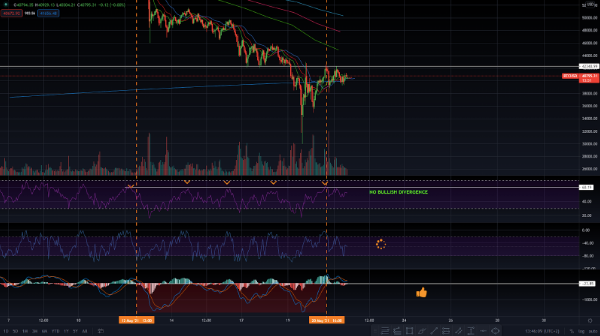
RSI - The RSI is bearish on the hourly chart. From the recent 30K - 42K move the RSI did not hit the 70 level as needed. Instead the RSI touched the 60 resistance and bounced off in a negative direction.
%R & WAI - both are stagnant showing a lack of direction, however the WAI suggests that bullish movement is most likely.
MACD - The MACD is bullish. It has ventured into the positive zone for the first time since 12/05/2021.
BTC indicators 21/05/21
BTC dominance chart
Since the 40K - 30K move BTC has seen a full retrace, however the same cannot be said for alt coins. On the BTC dominance chart BTC has seen a clear break from the previous trend line. The focus seems to be back on BTC, BTC.D should see a further increase. This leads us to two conclusions.
If BTC sees bearish price action - alt coins will continue to lose significant value, destroying portfolios worldwide.
If BTC sees bullish price action - alt coins will be somewhat stagnant in comparison to BTC. alt (x) / BTC charts now on the whole look bearish. I have included the DOT & GRT BTC charts below as an example.
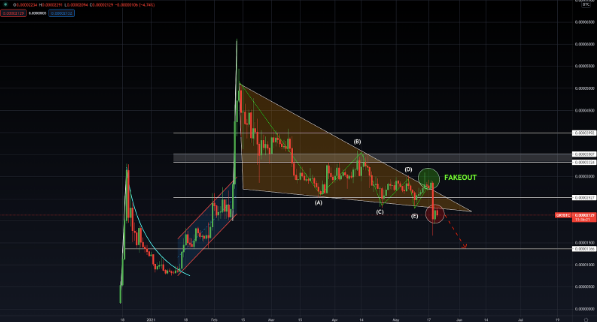
GRT/BTC - Bearish
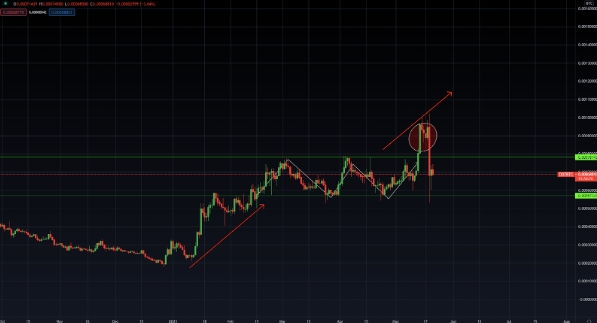
DOT/BTC - Momentum clearly lost - sideways movement expected
In the chart below we can see the BTC dominance shift with the trendline finally broken.
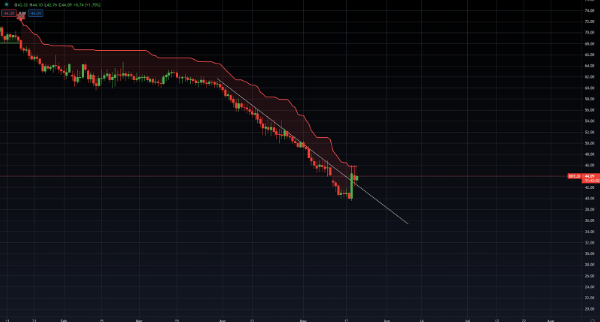
BTC.D
BTC conclusion
BTC is currently shaping the cryptocurrency market. Alt coins are suddenly looking less attractive and BTC is at a crucial stage in keeping its bull run in shape. On the whole we can neither be bullish or bearish until we see a breakout. The most likely direction looks to be bullish. However the recent descending wedge looked highly likely to see a bullish breakout and we know how that ended…