Hey folks, @cryptokraze here and I am going to cover technical analysis of $Blocktix for Short trade. I am using tradingview charts and price linked to Bittrex exchange. Let's have a look on technical aspects of $Blocktix.
Possibility on 1 Hour Chart
tix1hr.png
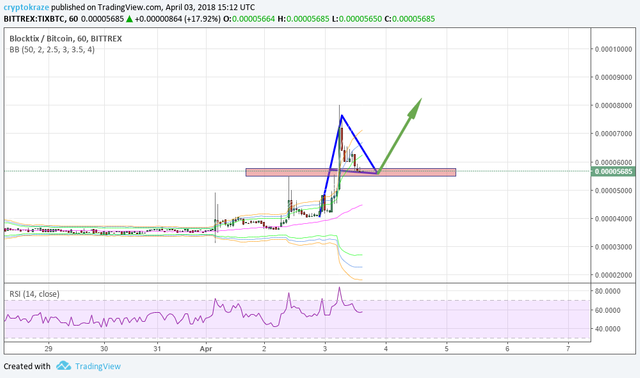
If you look at 1 hour chart, you will see $Blocktix has made an impulsive move and now it is forming a bullish flag. This is a very common pattern in cryptocurrencies, whenever a coin breaks with the big impulsive move, it pulls back and waits for some time before making next impulsive move. If we look at RSI, it has gone above 70 level in first impulsive move and has to dip close to 50 level now, so we have a pull back done and next impulsive move is ready.
I have a buy entry at 0.00005600 with my profit target around 0.00008200 or above.
Stop loss just below the entry area is must for trading if you don't know the Averaging Technique in Crypto Trading.
