Is this a point of inflection?

Yes, yes it is. Bitcoin is range bound on a level of support known as a pivot. Test after test and we have yet to break higher or fall lower. There were and are some great trades to be had here, but how come we are taking a break from the moon launch?
Bitcoin is at what is known in math and technical and fundamental analysis as a point of inflection.
In math, an inflection point is a period of a graph or curve in which the curvature of the statistic changes, choosing a new direction. The point of inflection can be flat, a peak or a trough.
In equities trading, a fundamental inflection point is when a news item or event changes the curvature of the graph - this could be an earnings event, a new product, an SEC investigation, anything good or bad, and is too some degree unpredictable.
In equities trading, a technical inflection point is an upper (resistance) or lower bound (support) of the graph, where the price tends to gravitate towards. In technical analysis these points on the curve work as buy and sell signals and are typically quite predictable.
So lets look at bitcoins daily chart.

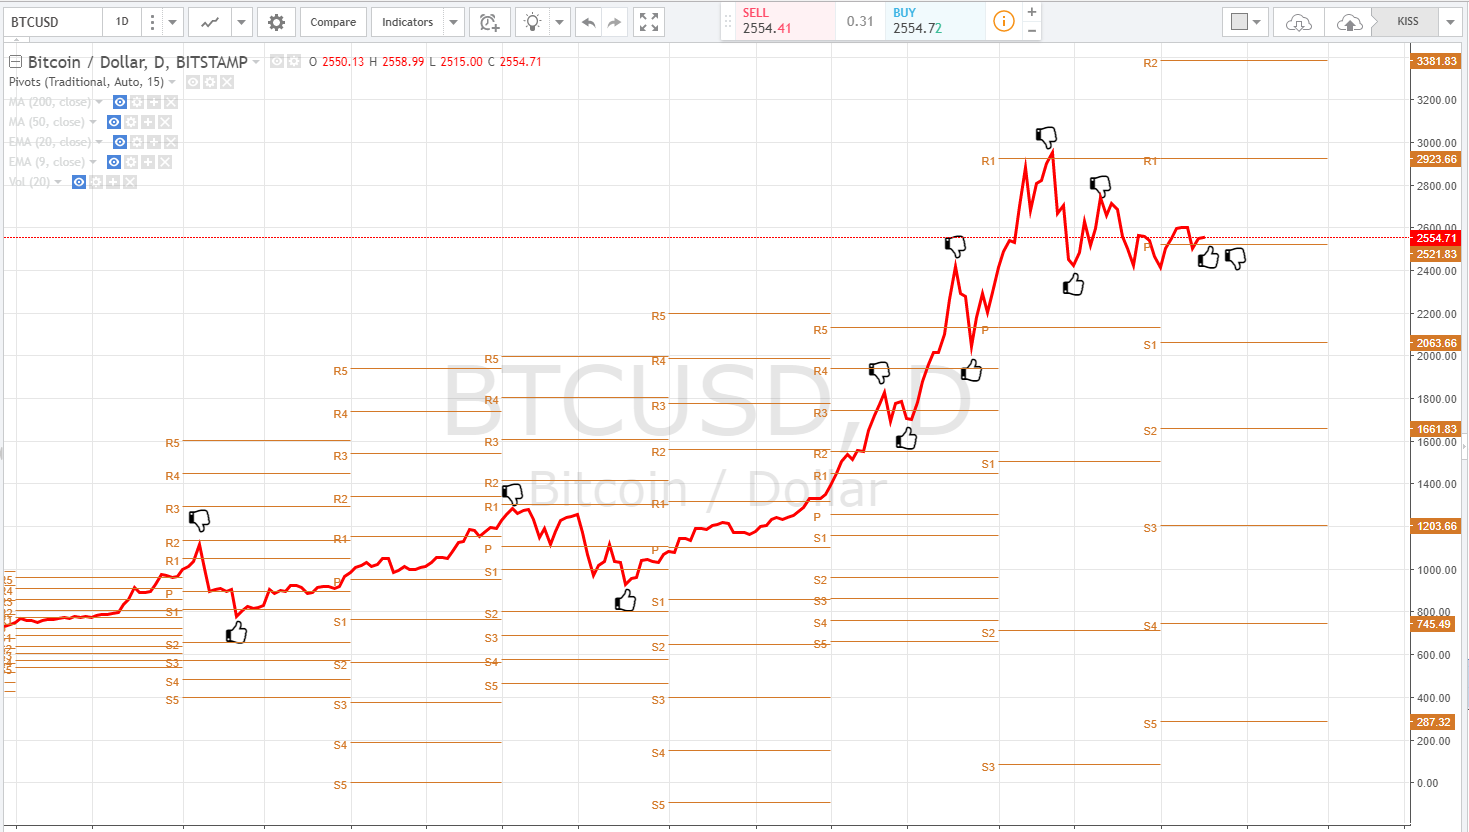
Using the above definitions we see that the recent top in bitcoin, just shy of $3000 was a point in the graph where the curvature changed, a point of inflection.
So why is this relevant? Well, taking into account the above definitions and in analyzing the above chart, we recognize that the curve is flattening at the daily pivot ($2521) and the 50 day moving average (currently $2516) with buying pressure coming in on those supports, albeit not much.
Could it be that a big move is in store?
Very likely, it is my view that this period of what is known as price consolidation will lead to a big move in bitcoin. Either up or down, that is very difficult to say but traders and investors should be prepared for either.
If we look a little further, in the context of a point of inflection, we notice that this range is getting bought, as by the technical definition this is a lower bound or area of support. We also see our 9, 20 and 50 period moving averages are converging, or rather normalizing. If the 9 and 20 cross below the 50, this is a bearish signal, if they bounce off the 50, the bias is bullish.
I am not suggesting to panic buy or sell at this convergence, not in the slightest. Technical analysis is a form of gestalt - the sum of its parts. While one technical indicator could be screaming one thing, another can be suggesting the complete opposite. What I am perhaps suggesting to those with less knowledge or experience in investing or trading, wait for the move to start before taking a position, miss a penny, save a dime.
In charting bitcoin while, I have found the micro movements to be quite predictable, I do not have a crystal ball, and I cannot see the future. Technical analysis is simply a tool for entry and exit of an equity or asset.
What can throw us all off, is a fundamental point of inflection. I believe this to be the segwit or soft fork recently approved. We certainly don't have enough information to decide how good or bad this is for the price of bitcoin but it can certainly change the game.
In my experience charting assets and equities, strangely enough technical and fundamental points of inflection tend to converge. It is also quite possible that this fundamental event has been priced in, as is typical in the stock market. If you have ever heard the phrase "sell the news," this is observed at the recent top in bitcoin and announcement of the segwit. It is quite possible that the event is priced in and upon occurrence, we may see a rally - key word, Possible.
Why is this? The chart tells the story of the underlying asset. Past events were either priced in beforehand or are a surprise and have to be priced in, in real time. This makes for some volatile trading.
What ever happens, these are exciting times for the crypto-currency markets and it is my hope that understanding what a point of inflection is technically, fundamentally and mathematically will become just another tool to use in your trading and investment journey.
Bitcoin Line Graph - Chart History Points of Inflection

Good luck and happy trading!

<3 Follow me @satchmo
Not Trading or Investment Advice - Educational resource
I like bitcoin
Downvoting a post can decrease pending rewards and make it less visible. Common reasons:
Submit
No shit dude!
Downvoting a post can decrease pending rewards and make it less visible. Common reasons:
Submit
Very well written insight into something not a lot of people know about! Kudos!
Downvoting a post can decrease pending rewards and make it less visible. Common reasons:
Submit
its good that it floors, was a huge ride this year. Give it some rest before it goes to 100k
Downvoting a post can decrease pending rewards and make it less visible. Common reasons:
Submit