This is not a recommendation to buy or sell. This is for entertainment purposes only
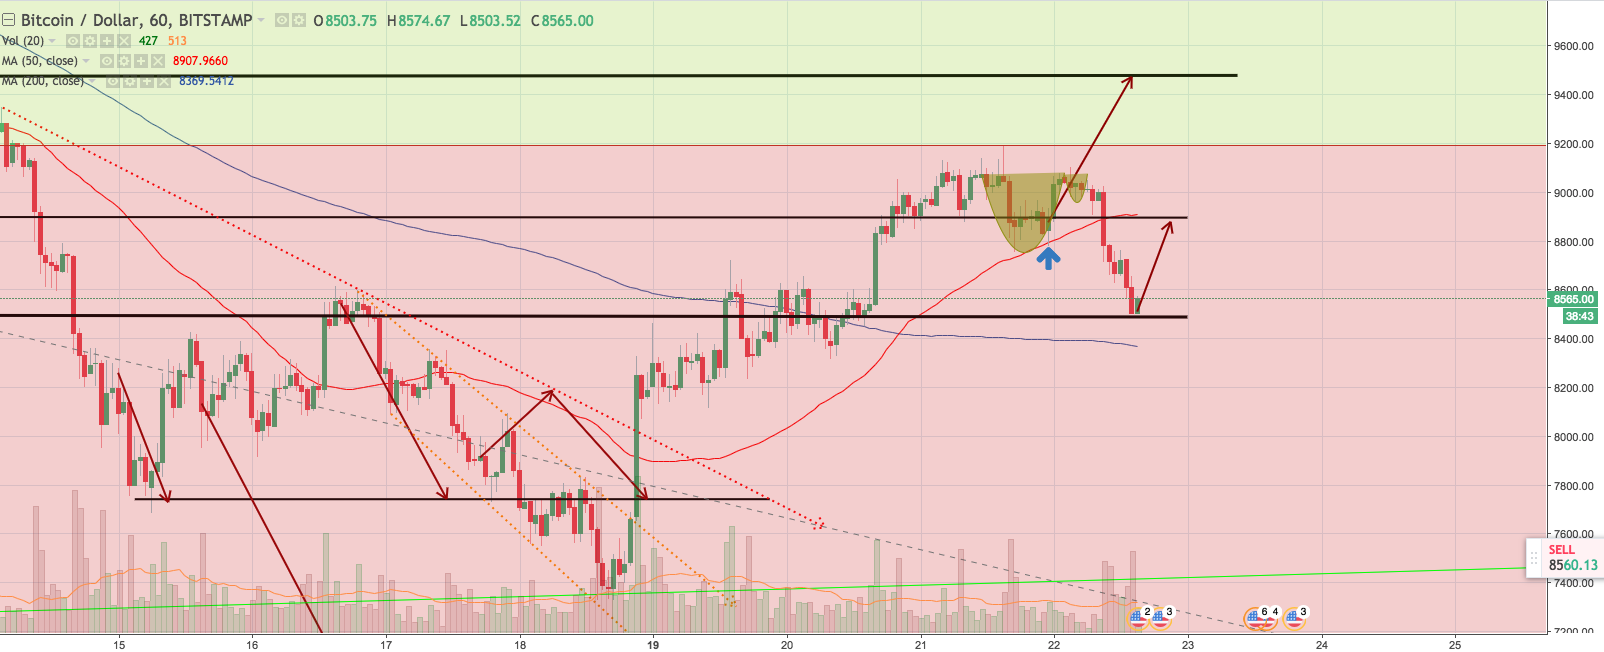
Yesterday I expected us to break up $9,200 resistance. I drew an arrow up to $9,481 after seeing support hold at $8,800 and a bounce from the 50 day SMA.
The daily chart had a reversal doji combined with resistance from the 200 day SMA. If I paid more attention to that then I would have been more cautious with my bullish predictions.
We are currently testing support at $8,500. We should bounce from here up to $8,800 where horizontal resistance will be combined with the 50 day SMA.
I am still waiting on the sidelines for further confirmation.
Likes and follows are always free!

Agreed, its also bouncing off a nice support/resistance structure at the moment:
Downvoting a post can decrease pending rewards and make it less visible. Common reasons:
Submit