So many different scenarios can confuse and stress everyone out, so i have tried to narrow down the few i have found by selecting the strongest BULLISH and strongest BEARISH scenarios and running through them.
BULLISH : INVERTED H&S
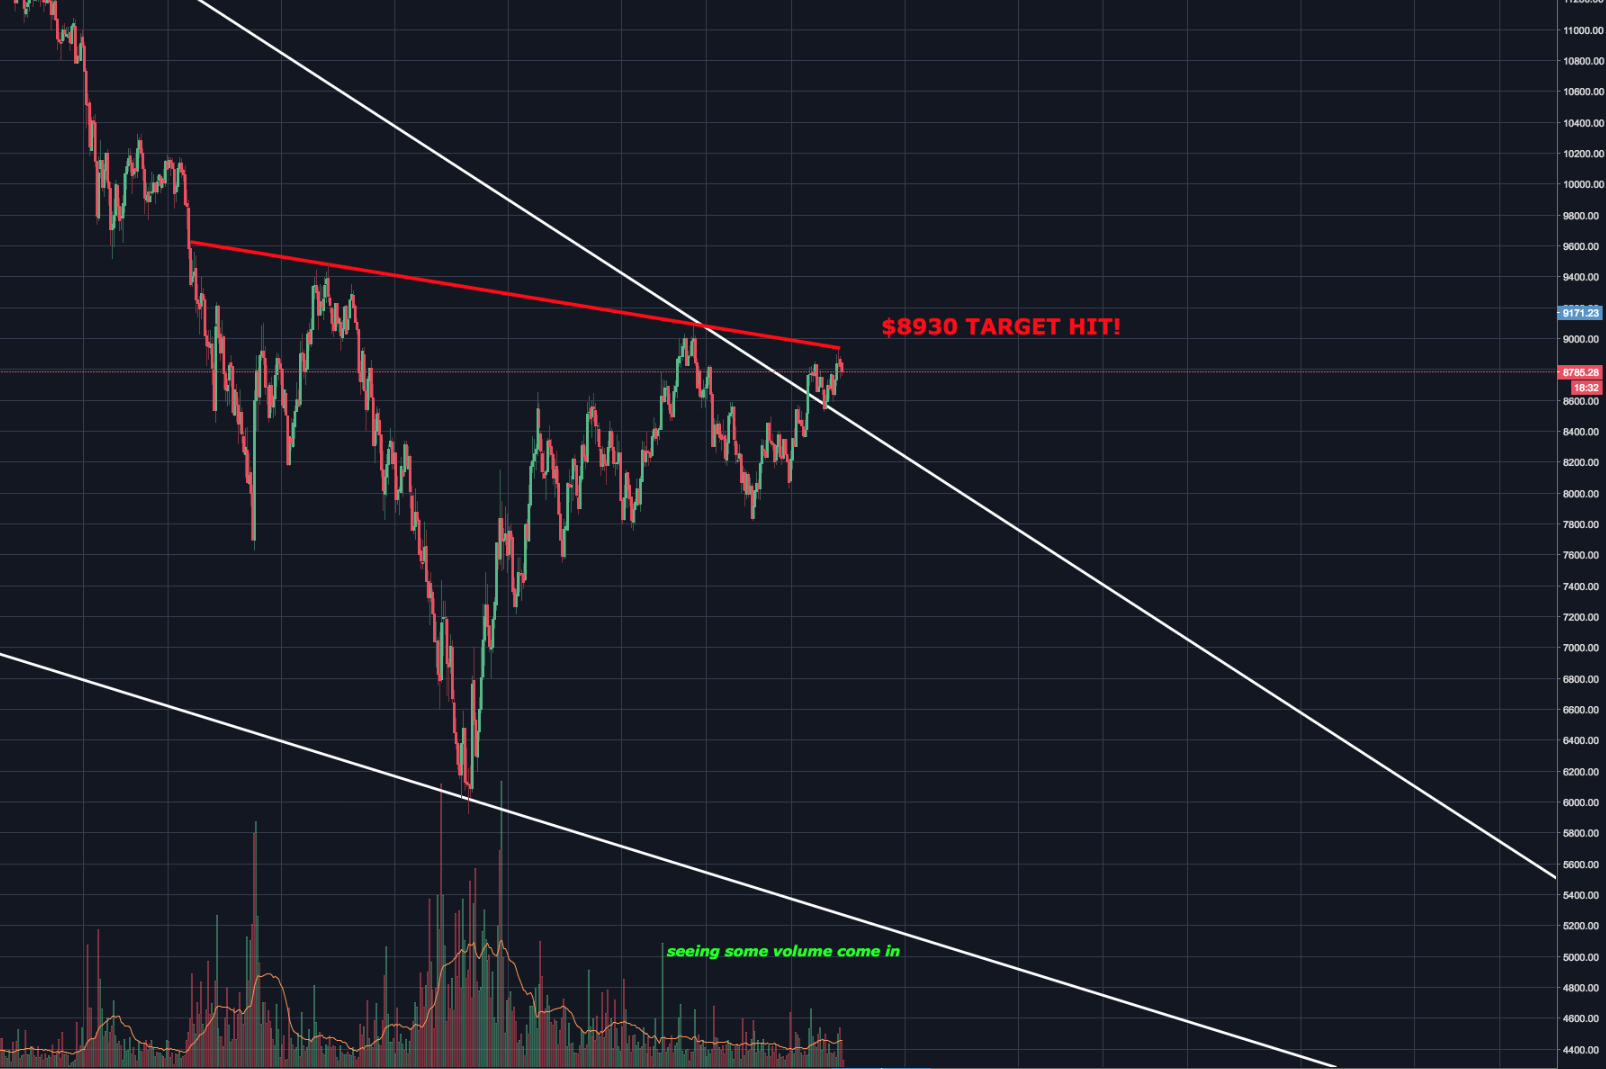
Repeated predominantly in nearly all of my last posts, been keeping a close eye on this one over the last week with my target also being hit overnight! ($8390) .
However without a proper breach of this price we will not be going anywhere, need to hit it with some force and break through properly for them juicy gainz.
Finally we are beginning to see some more volume come into that right shoulder also but i am still so unsure of this working out correctly just because of the volume levels and how when drawn they do not project the same Head and Shoulders image as the price chart does.
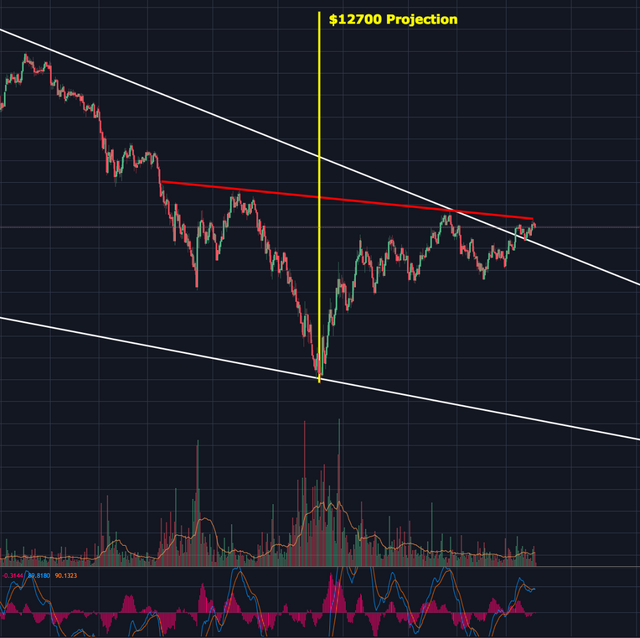
However, if this is to go ahead and be 100% confirmed , the projected target still stands at the $12,700 mark.
For this scenario to be confirmed, i will be waiting and watching for a breakout beyond the 9,000 region, to be safe i may even stay out until i see 9,500 broken as they are two major resistance points we should be keeping close watch on.
BEARISH : BEAR FLAG or BULL TRAP OUT OF WEDGE
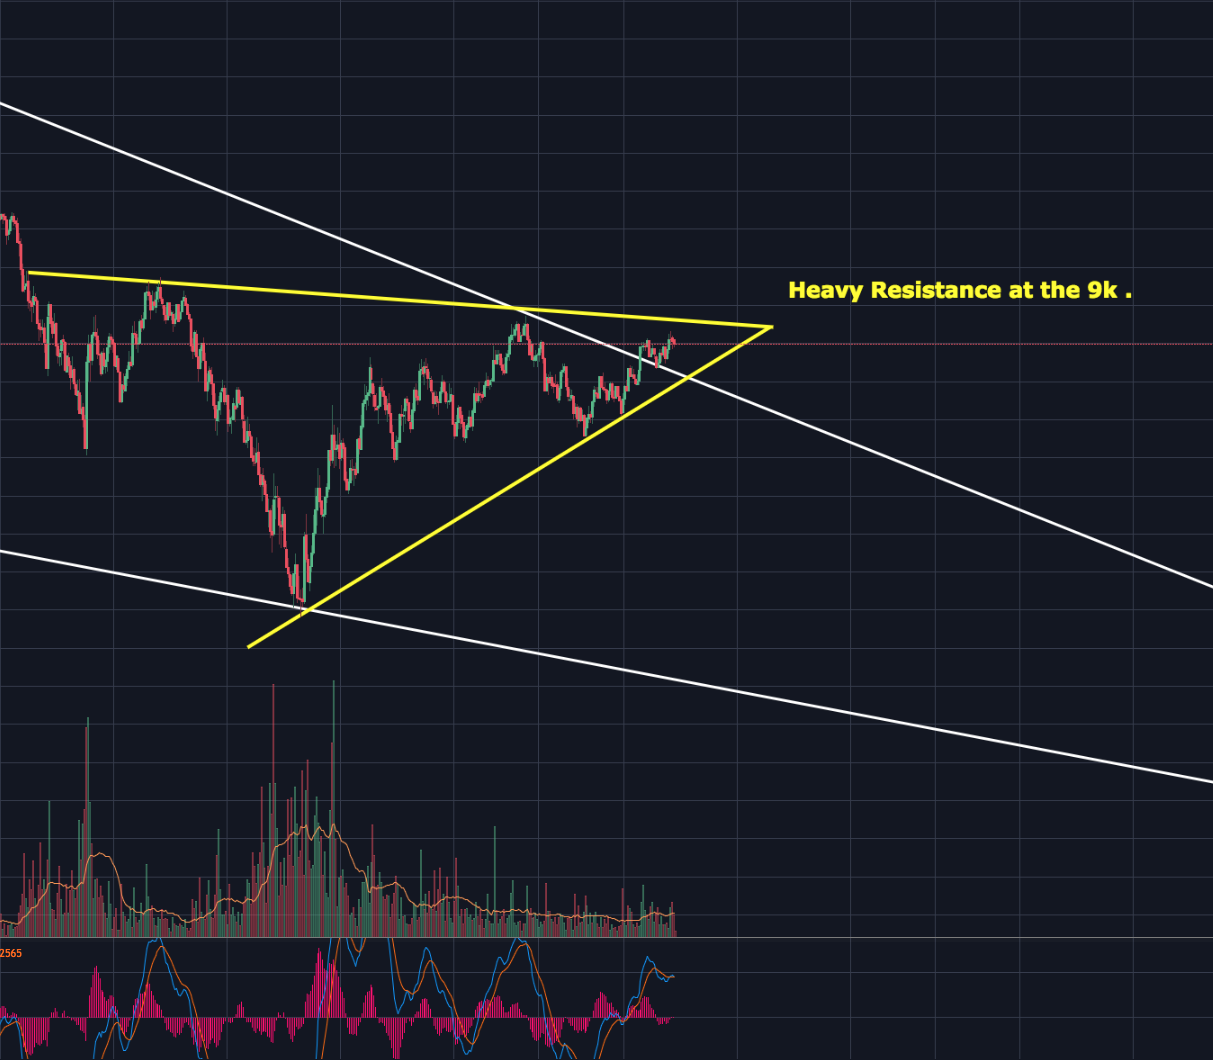
As price broke from the main larger wedge, there is no reason it couldn't just sneak its way back in slowly. Until this is broken with some real height and force a breakout cannot be confirmed. If the Bullish Scenario is not to play out due to volume not confirming , a bear flag has also been spotted which could bring prices towards $9,300-$9,500 before a strong drop downwards back into the wedge to reach another low.
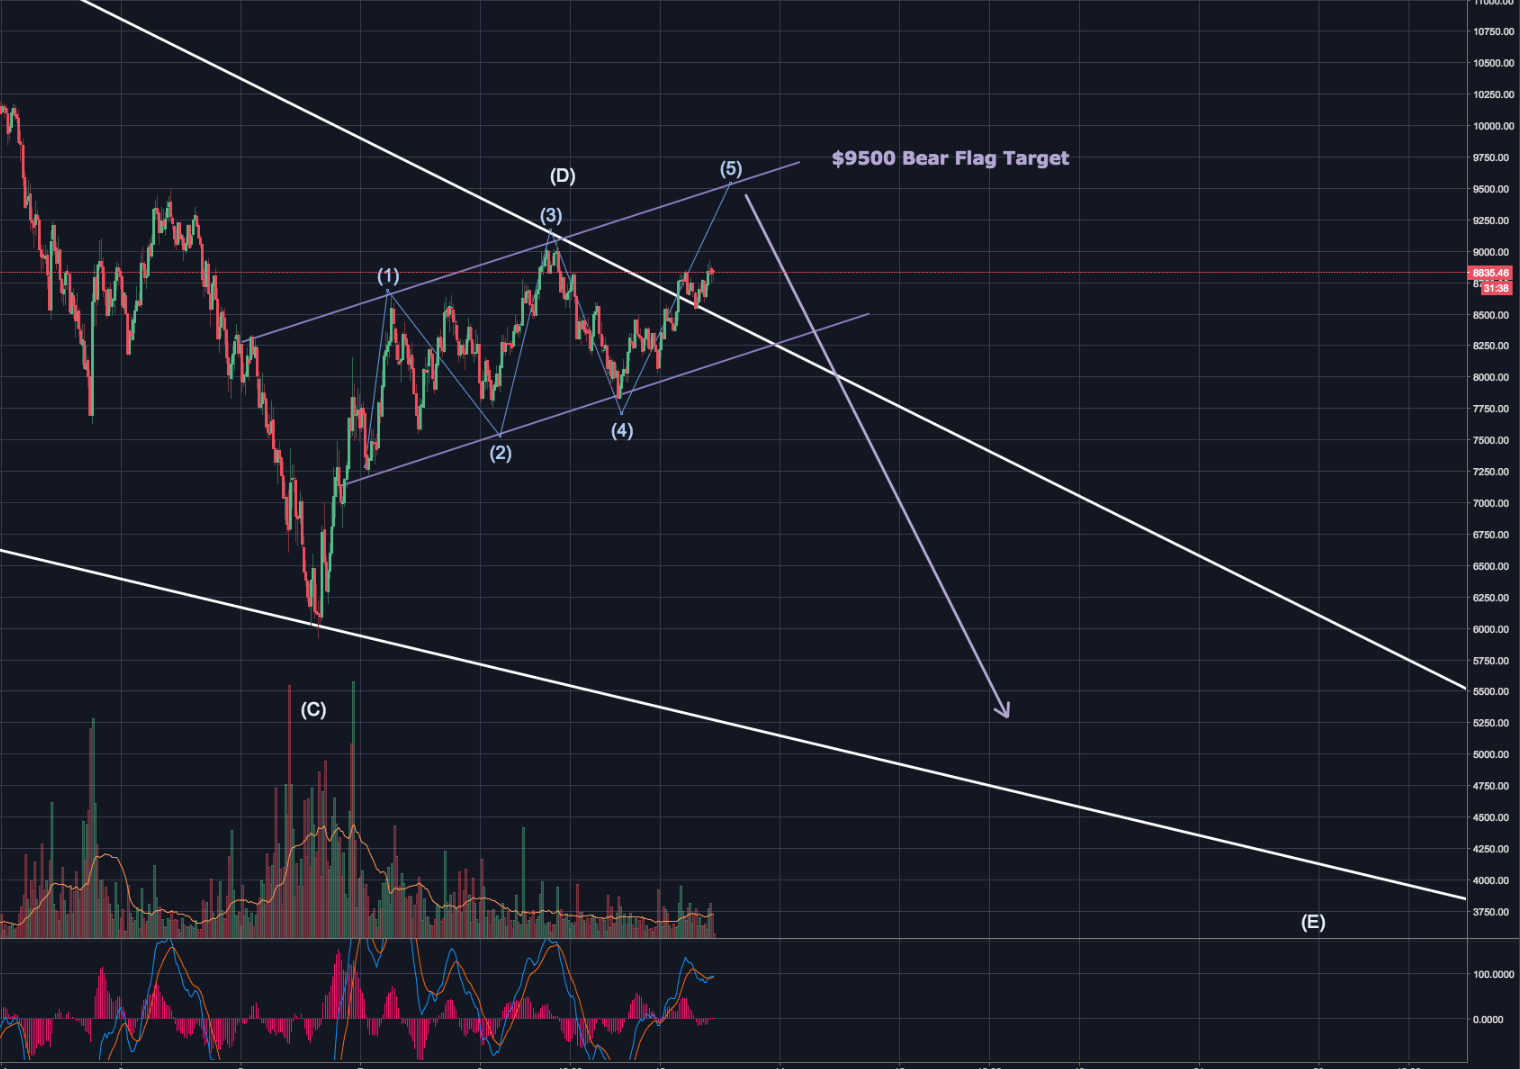
But even getting to this point will not be easy as there is heavy resistance from two major points. Which will make it tough for prices to break over the $9,000-$9,300 region.
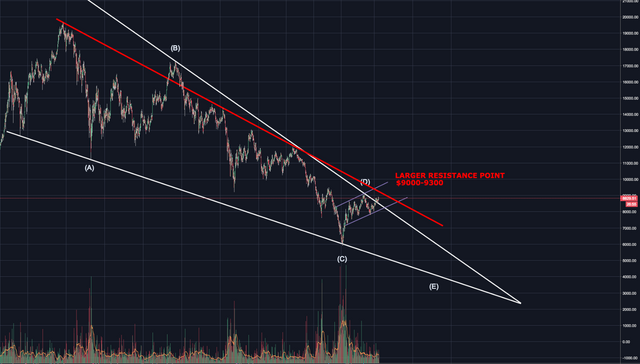
(Looking at this larger resistance though it has had a fair few touches and even a break at one point so it may be weaker than first thought)
And this other little wedge is another resistance line which i will be watching as a breakout above the yellow line may be some actual confirmation of a real breakout with the possibility of not another lower low occurring until after we enter the $11,000-$12,000 region.
BUT we could also break downwards on this! which could see a retracement into the $7k area where we can again reassess our situation.
WHERE IM STANDING
I am still waiting on the sidelines until i see a 100% confirmation of an uptrend. The Three biggest prices i will be watching for a breakout will be the $9,000 , $9,300 & $9,500 .
(Keeping an eye on my smaller yellow wedge specifically)
If prices break these resistance points we may just continue upwards!
(Particularly $9,500, if this is broken may see our way upwards to $11,000-$12,000)
While price could glide back into the bigger wedge at anytime, the risk is not entirely worth it.
Legal Disclaimer: I have no idea what I'm doing and I'm not telling you to follow me or make investments based on this information, this is just my thoughts and ideas and what ill be following. Happy Trading!!