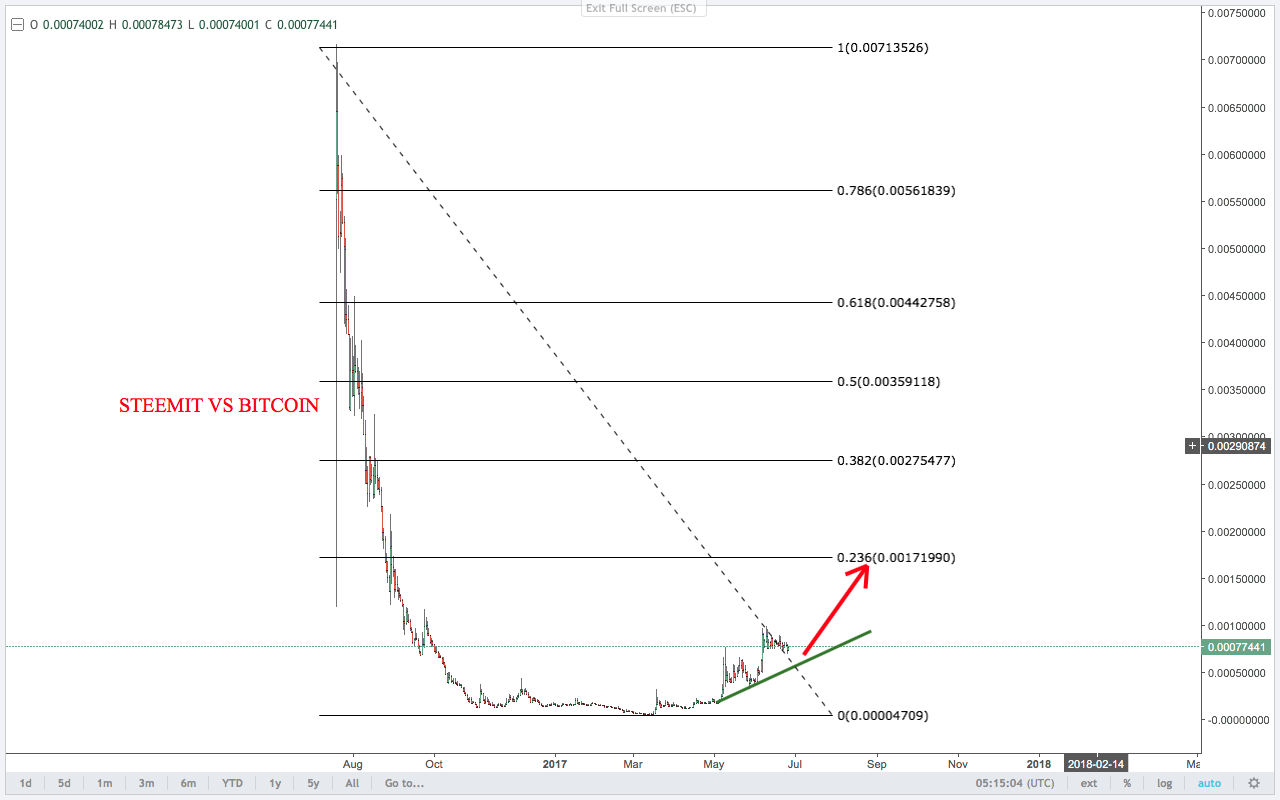
Steem vs Bitcoin Daily chart
Buying support on the green trend line where buyers sitting in next possible stop for the currency is 23.6% fibonacci ratio
where the price can reach to $4 on the present bitcoin price.
👉👉👉👉👉 Join for free analyses every hour 📊📈📉💴💵💸💶💷💰👈👈👈👈👈
👉👉👉👉👉 Click here telegram https://t.me/tradingwithmanju 👈👈👈👈👈👈💵💴💶💷💸💰
Like our Facebook page for more updates: https://www.facebook.com/ForexGuruSignals
Subscribe to our signal services for entry and exit….
👉👉👉👉👉 website: www.tradingwithmanju.com/packages 👈👈👈👈👈👈
Also join our exclusive Facebook group for fastest updates on all forex currencies
https://www.facebook.com/groups/tradingwithmanju/
Also join our exclusive Facebook group for fastest updates on all crypto-currencies
https://www.facebook.com/groups/cryptocurrenciesshop/
