(image source Google.com)
Bitcoin price on Monday depreciated against the US Dollar after consolidating sideways for the whole Asian and European sessions.
The BTC/USD at the beginning of the US trading hours formed lower lows towards 6239-fiat. Before that, the pair was trading sideways owing to minimal momentum. It kickstarted the Asian session with just shy of 6500-fiat and recorded marginal gains as the day matured. BTC/USD started retracing below 6500-fiat during the early European session, displaying weak pullbacks from the said psychological level. And, right around the time of this writing, and at the beginning of the US session, the pair has dropped by more than 2.5 percent already.
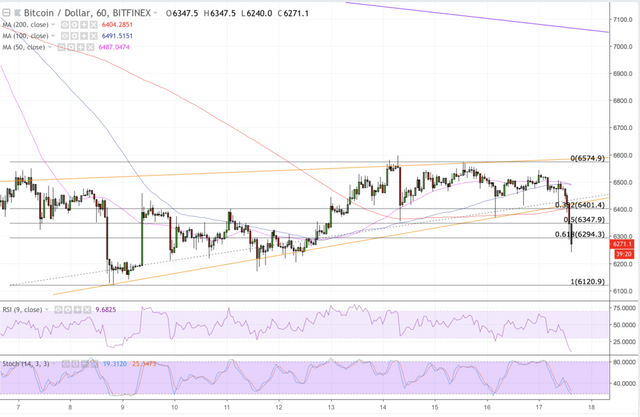
In one of our previous analysis, we had put BTC/USD inside a near-term rising wedge. We had expected the pair to bring potential entry/exit positions between the wedge range. So it happened. But, with the support of the rising wedge broken, we are looking at bear pole formation in the context of the medium-term bearish bias.

BTC/USD Technical Analysis
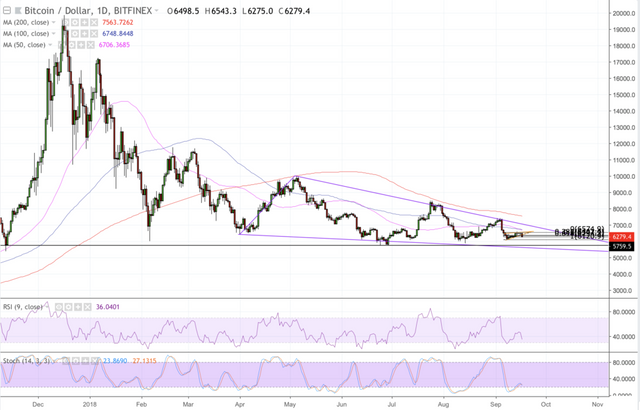
The breakdown below the near-term rising wedge appears in line with the giant descending triangle formation. So far, BTC/USD is forming lower highs and lower lows which could mean a nasty bearish breakdown below the 5759-bottom. That could put Bitcoin on a path towards 5000-fiat, the support from October 2017. A bounce back from the bottom, however, could prove stronger than usual for the sheer buying enthusiasm the level offers.
Moving on, the bearish bias in near-term charts could intensify further, as far as the technicalities are concerned. BTC/USD is trending below its 50H, 100H and 200H SMAs. The 50H SMA particularly has crossed below the 100H one, indicating a selling sentiment in the market. The RSI and Stochastic indicators are also inside a selling area and them sulking into oversold areas should not surprise.

BTC/USD Intraday Analysis
The latest drop has invalidated 6400-fiat as our reliable support level, and we are in a state of breakdown. BTC/USD should expect an extended sell-off period with a focus towards 6200-6220-fiat as the next potential support area. We are also switching our range levels in line with our intraday strategy below.
So, the range we are watching for now is defined by 6620-fiat as interim support and 6347-fiat as interim resistance. For now, we are waiting for BTC/USD to attempt a break below support to clear our short position towards 6120-fiat. In this position, we will make sure to keep our stop loss just 4-pips above the entry point.
On a bounce back from support, we’ll go long towards 6294-fiat, the level coinciding with the 61.8% Fibonacci retracement level while keeping our stops just 2-pips below the entry point. A further break and our upside target will move to 6347-fiat.
Trade safely!
Hi! I am a robot. I just upvoted you! I found similar content that readers might be interested in:
https://www.ccn.com/bitcoin-price-intraday-analysis-btc-usd-wedge-support-broken/
Downvoting a post can decrease pending rewards and make it less visible. Common reasons:
Submit