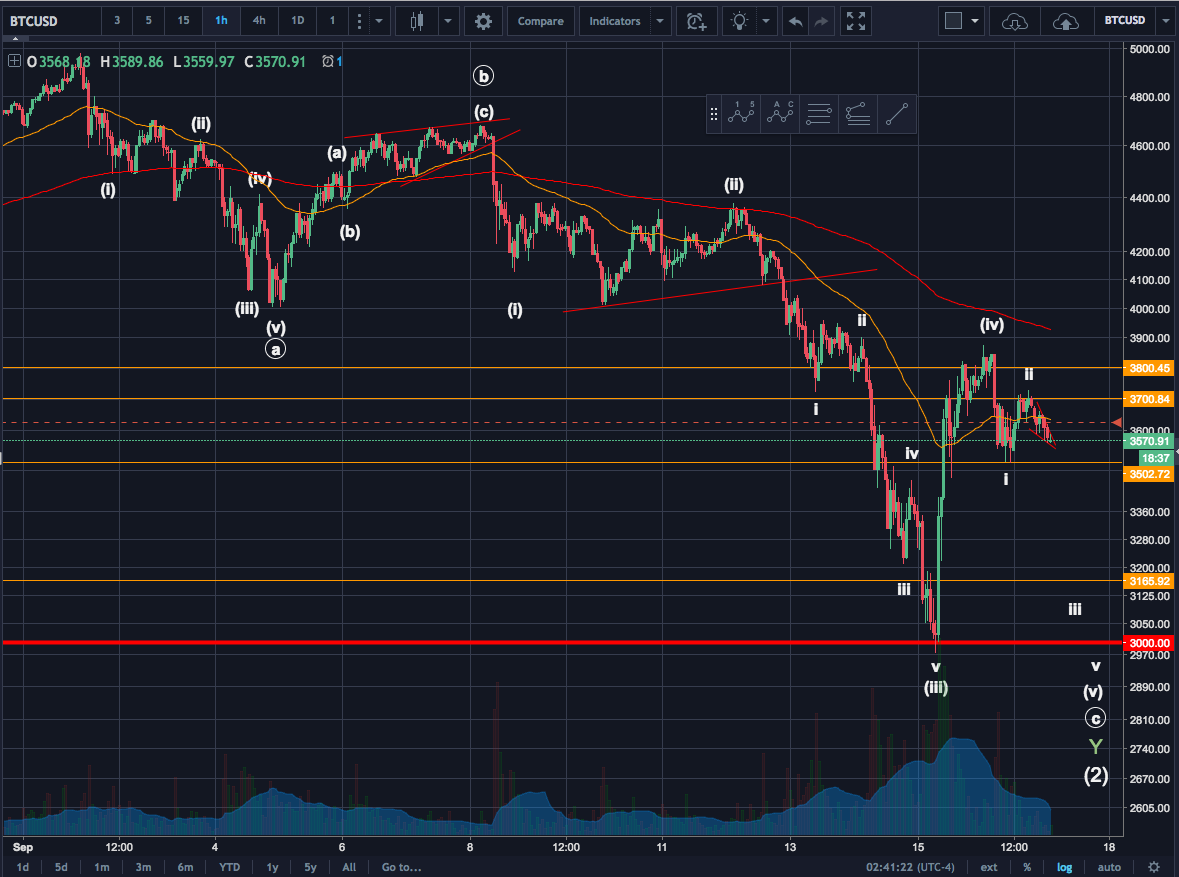
There are a few problems with that chart.
First, the timeframes of those waves are off. The ABC waves are labeled as intermediate waves, yet it's clear the first (A) wave took less than 5 days to complete, which is too short to be an intermediate wave since they should run weeks to months.
Second, both the first ABC and the second ABC are being labeled with intermediate degree waves which is confusing to look at. If the second ABC does contain the first they should be different degree waves.
Third and most important, it's only possible for the A wave of a flat to be a three wave move. The larger pattern here is a zig-zag in which case A must be a 5 wave move. It's possible to have 2 three wave moves as part of a larger zig zag, but in that case the second (larger degree) ABC should be labeled WXY, since that is appropriate labeled for a double zig-zag pattern.
Also, I really don't like their first (C) wave. They're neglecting to label the first move downward and it's correction. There is no way that is part of their wave (1) as it's much larger. It looks like perhaps they are considering the first C to contain another ABC which is possible, but again should be labeled WXY instead.
Another labeling complaint is that they have cycle wave IV lasting roughly 25 days. Cycle waves should last 1yr to several years.
If one were to clean up their labeling, it could be a valid wave count. That said, I don't think it's necessary to label that move as a complex correction when a simple correction fits it well. Here is my labeling for the same correction.

I hope this is helpful.
Thank you for your brilliant analysis. Learning a lot from you.
Downvoting a post can decrease pending rewards and make it less visible. Common reasons:
Submit
My pleasure!
Downvoting a post can decrease pending rewards and make it less visible. Common reasons:
Submit