In previously we see that bitcoin break even expences are $5300 to $5800.
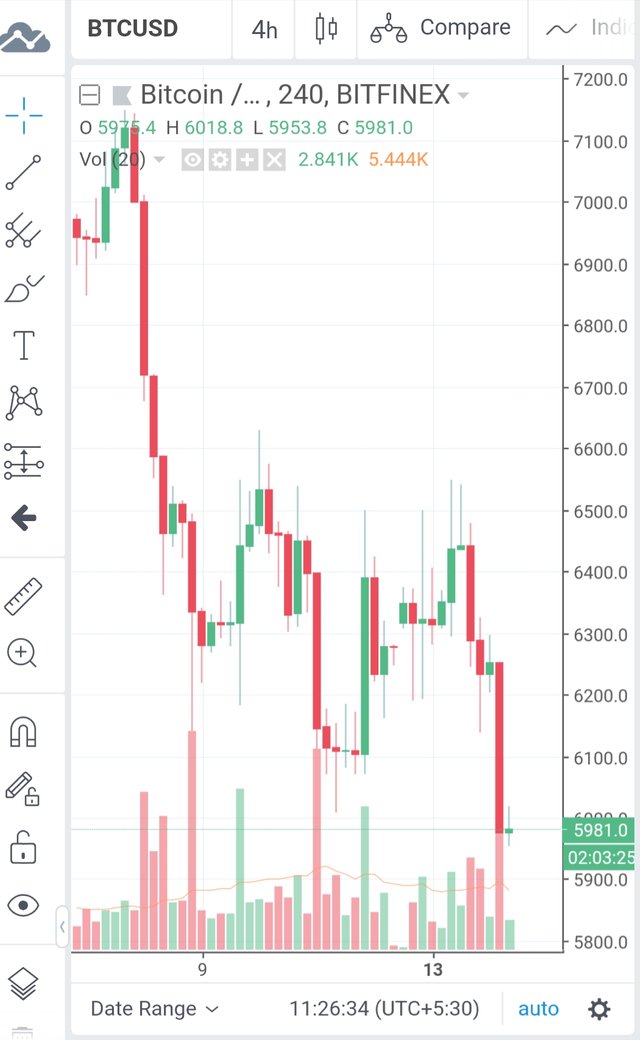
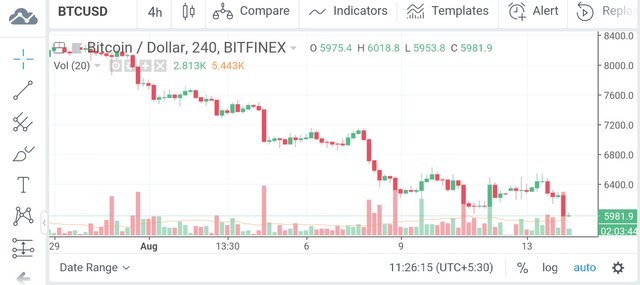
technically it breaking $5782 than it draw toward $5350 that is daily chart shows that.
Now a days bitcoin price has already on a rough and SEC decision weigh on Bitcoin.
Bitcoin market is actually drawing some demand on turkey crisis in turkey and traders are away from fiat currency and europion stocks.
USD demand shows possibally give a support. This is main reason to bitcoin price selloff mode.
last day trading range between $5782 to $6510. And the intraday low is $5858 and high is $6548.
As per 4H chart shows that bitcoin is in bearish mode $6964 is main resistance to protect bearish trend.
stochastic shows oversold level and RSI indicate selling pressure, ossicilator reflect bearish exhaustion.

- Bitcoin trend is shows a bearish as long as price are between currunt spot price $6964.
1st support level is $5782.
1st resistsnce level is $6510.
2nd support level is $5350.
2nd resistsnce level is $6963.
Expected trading range today between $5782 to $6510.
Expected trend is bearish today.
Thats all
Have a nice day
If you have any querry comment me.
If you like this post UPVOTE it and RESTEEM it.