Bitcoin is showing signs of life, but only a break above key resistance at $6,675 would confirm a bullish reversal, technical charts indicate.
At press time, the leading cryptocurrency is changing hands at $6,470 on Bitfinex – up 10 percent from the 6.5-week low of $5,859 hit on Aug. 14.
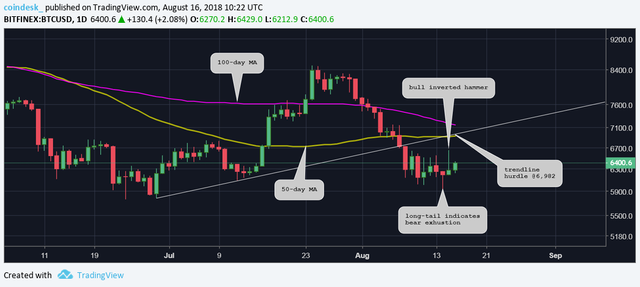
However, the break below the key support of $6,000 (February low) was short-lived and prices moved back above $6,100 by UTC close, signaling bearish exhaustion.
More importantly, the follow-through has been positive: BTC crossed Tuesday's high of $6,259 and jumped to $6,649 yesterday, confirming that sellers have likely run dry and bargain hunters are finding the current price too attractive to pass up.
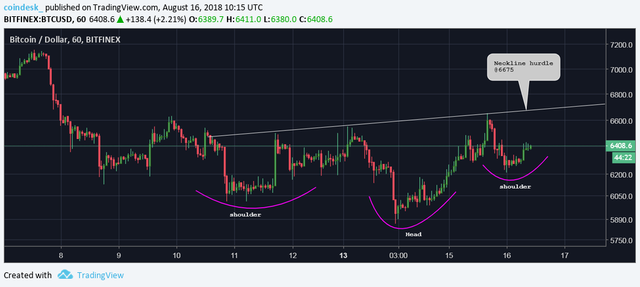
Hence, it seems safe to say that a bullish trend reversal is in progress and would be confirmed if prices take out the inverse head-and-shoulders neckline resistance of $6,675, as seen in the chart below.
Hourly chart
BTC is creating the right shoulder of a inverse head-and-shoulders bullish reversal pattern on the hourly chart.
A move above $6,675 would confirm the sell-off from the July high of $8,507 has ended and would open the doors to $7,490 (target as per the measured height method).
That said, the daily and the 4-hour charts show that BTC could attempt a break above $6,675 in the next 24 hours.
4-hour chart

As seen in the chart above, the cryptocurrency has pierced the descending trendline, meaning the sell-off from the high of $8,507 has ended. The relative strength index (RSI) has also adopted a bullish bias (above 50.00).
Daily chart

BTC created a bullish inverted hammer candle yesterday, adding credence to Tuesday's long-tailed (bear exhaustion) candle and confirming the cryptocurrency has likely bottomed out at $5,859.
View
- BTC bulls are slowly gaining ground and could attack the inverse head-and-shoulders neckline resistance of $6,675 in the next 24 hours.
- A break above $6,675, if accompanied by a pick-up in volumes, would confirm a bearish-to-bullish trend change and allow a rally to $7,490. On the way higher, BTC could encounter resistance at $6,924 (50-day moving average), $6,982 (rising trendline hurdle as seen on the daily chart), and $7,162 (100-day moving average).
- Acceptance below $6,180 (previous day's low) would pour cold water over optimism generated by the inverted hammer candle and would shift risk in favor of a drop below $6,000.
Disclosure: The author holds no cryptocurrency assets at the time of writing.
Bitcoin image via Shutterstock; Charts by Trading View
Join 10,000+ traders who come to us to be their eyes on the charts, providing all that's hot and not in the crypto markets.
The leader in blockchain news, CoinDesk is a media outlet that strives for the highest journalistic standards and abides by a strict set of editorial policies. CoinDesk is an independent operating subsidiary of Digital Currency Group, which invests in cryptocurrencies and blockchain startups.
Read original article
Posted from my blog : http://blog.sye.host/?p=1604

Hope it happens soon. Waiting for the bull run from so long.
Downvoting a post can decrease pending rewards and make it less visible. Common reasons:
Submit
I hope so too !
Downvoting a post can decrease pending rewards and make it less visible. Common reasons:
Submit