4H Chart - Price Key Points:
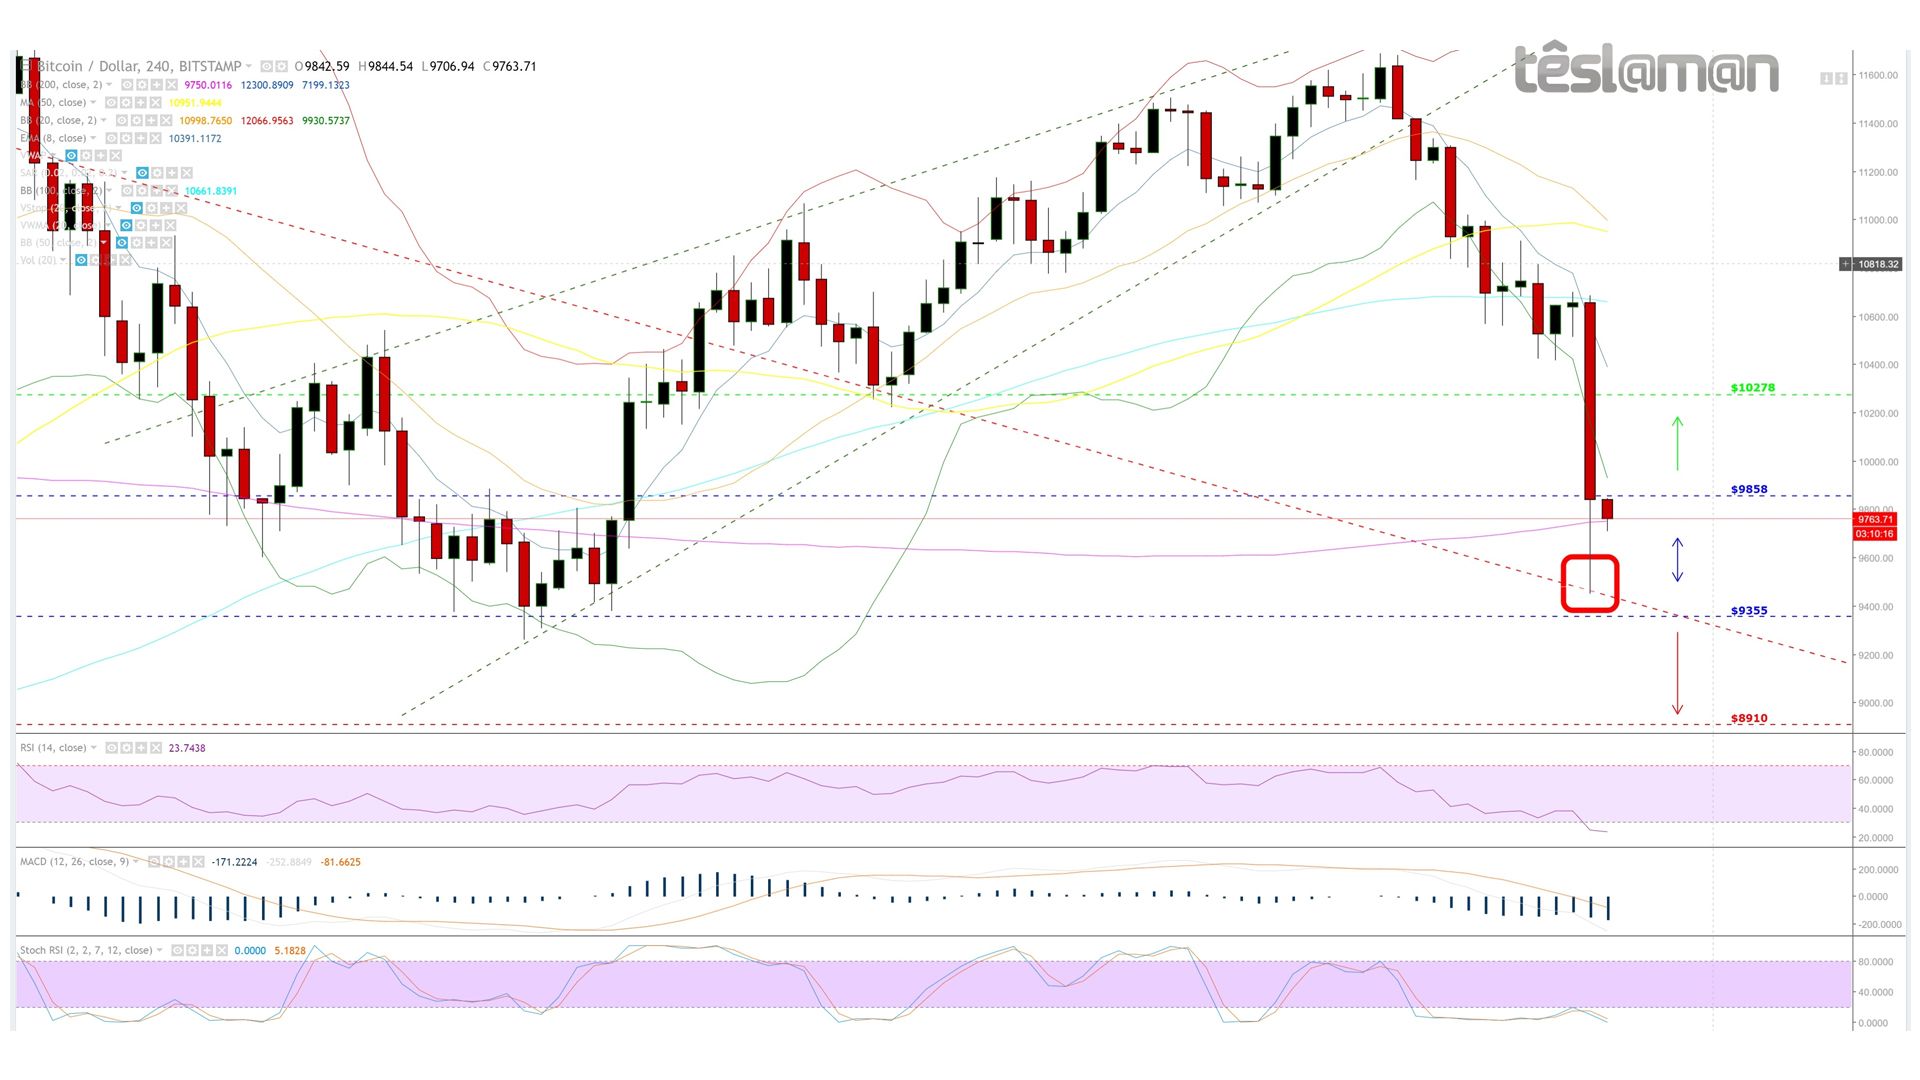
- Violent candlestick from $10865 down to $9450. Move seems to be stabilizing.
- Touched upper level of medium term downward channel which acted as support at $9450.
- The same point is where the 100MA lower Bollinger Band currently resides.
- Momentum indicators are somewhat oversold.

Possible Scenarios:
Long: On a confirmed break above $9858 – Price Target $10278 | Probability: 31% | Signal Strength: 2/5
Neutral: Price Range $9355 - $9858
Short: On a confirmed break below $9355 – Price Target $8910 | Probability: 33% | Signal Strength: 2/5
Our Stance: Model signals are balanced. TP on all Short positions.
Awesome post. Thank you for one more successful trade!
Downvoting a post can decrease pending rewards and make it less visible. Common reasons:
Submit