The past month I've seen a lot of posts showing the yearly January dip of Bitcoin.
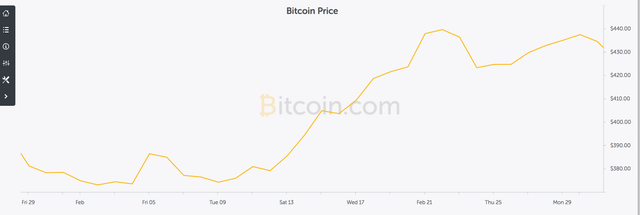
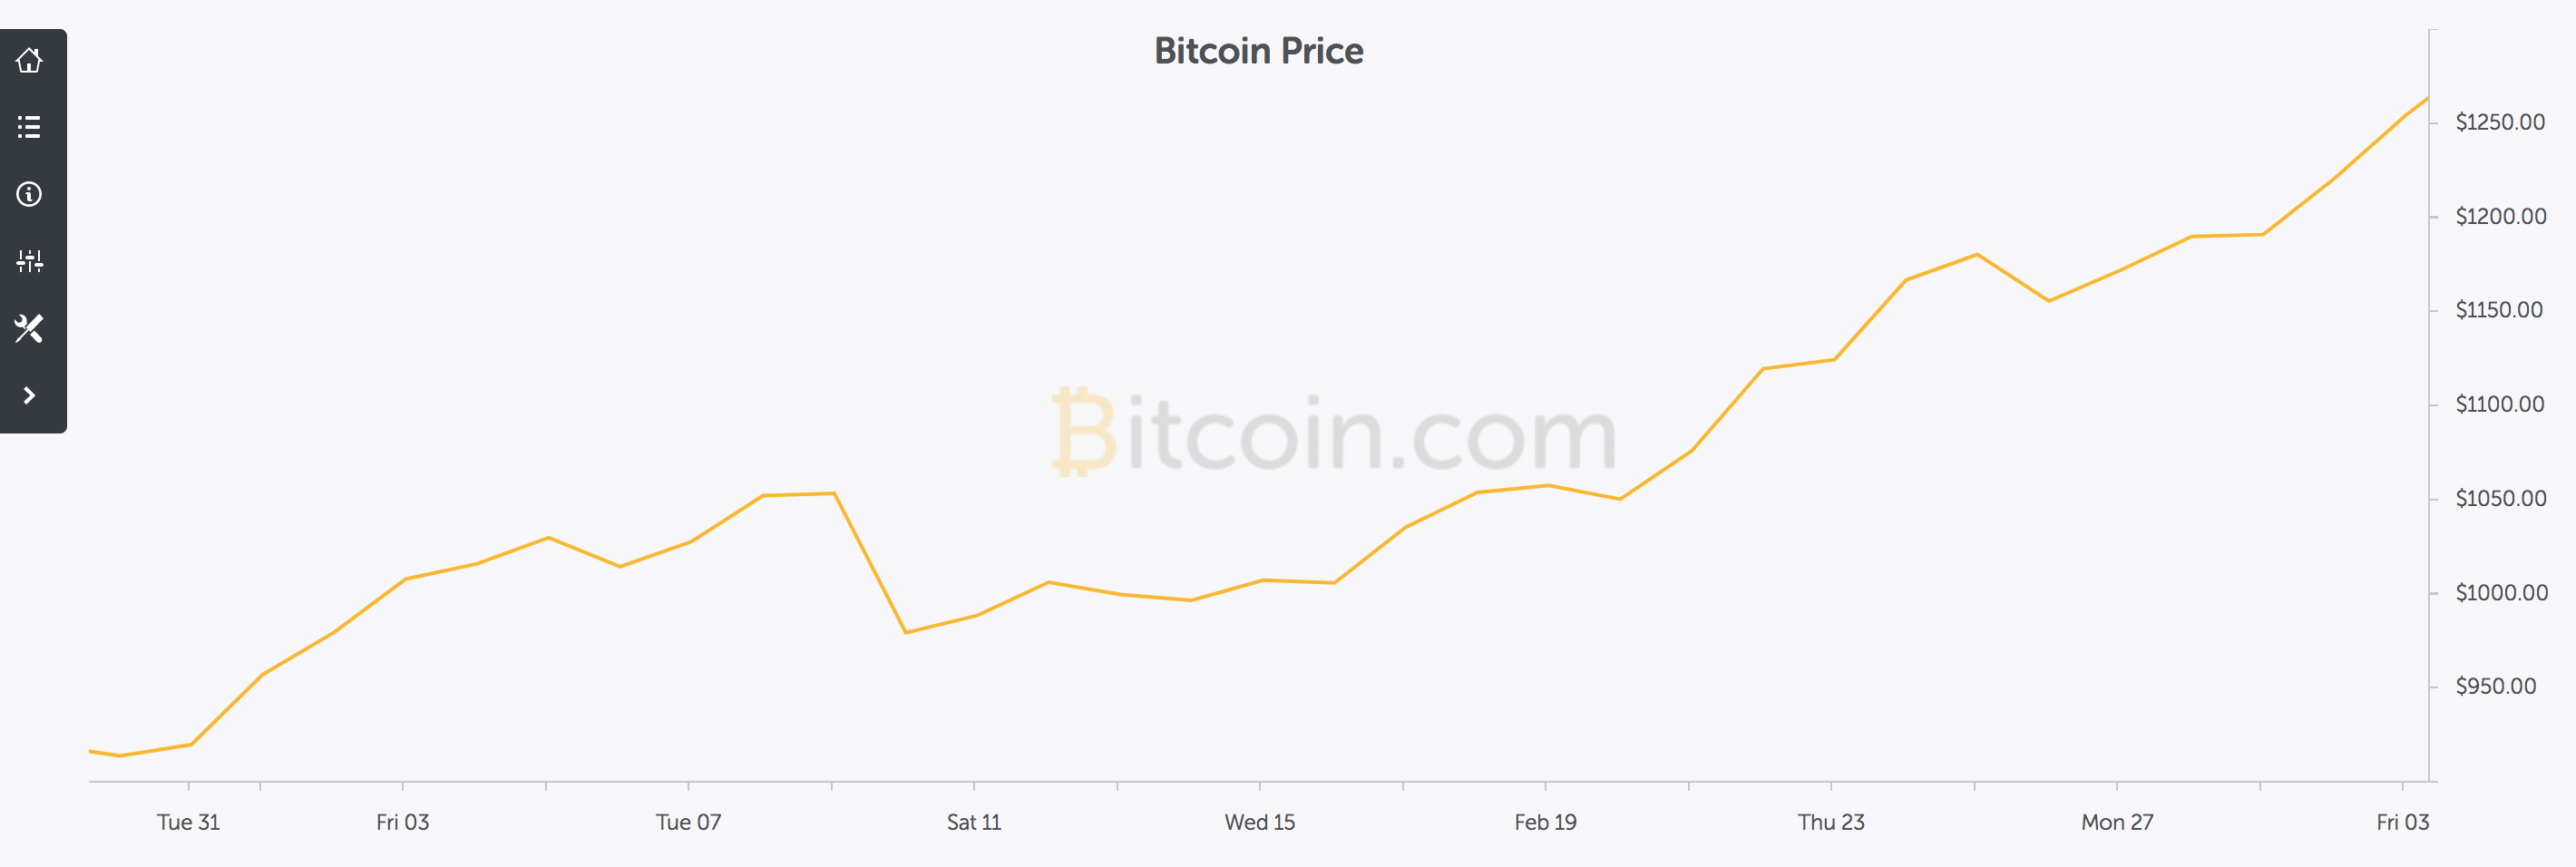
In this post I'll show the February charts of 2015 - 2016 - 2017.
2015

2016

2017

I'm in no way great in analyzing charts, but I do see a similar pattern coming back (Yay, it's going up!). What are your thoughts about Februari? Do you think we might see a similar growth?
Where can we sign to make this happen?
All previous years had an average rise of 20%, I would not mind seeing history to repeats itself!
Downvoting a post can decrease pending rewards and make it less visible. Common reasons:
Submit