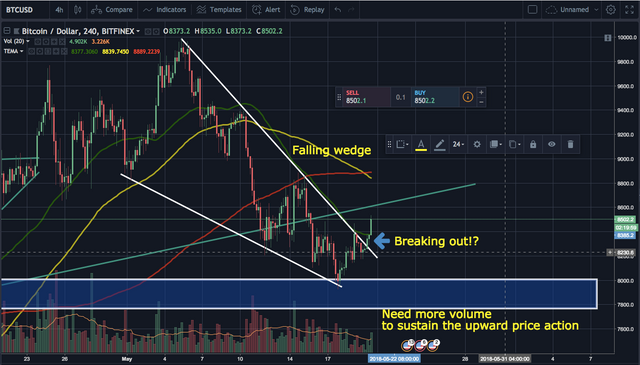
Falling wedge in 4h BTC/USD chart
BTC/USD is forming a falling wedge, which is usually bullish, and it's trying to break out upwards. It is common to see the volume diminishing during the wedge formation or any consolidation patterns but an increase in volume at the penetration of the trendline is quite important to confirm and sustain the upward price action, which is currently lacking.

Need more volume
If the volume picks up, then the price could go up quickly and test the 100 day moving average - $9,000 USD/BTC and $10,000 once again maybe within 2 weeks. Without volume, we would probably see more sideway price action and the price might stay between ~$8,000 - $9,000 USD/BTC.
Please upvote and follow me if you like the post.
Where I trade : Binance
Follow me on Twitter : Twitter
Disclaimer : I am not a certified financial advisor. This post is just my personal opinion and not financial advice. Please do your own research and do not trade just based on my posts.