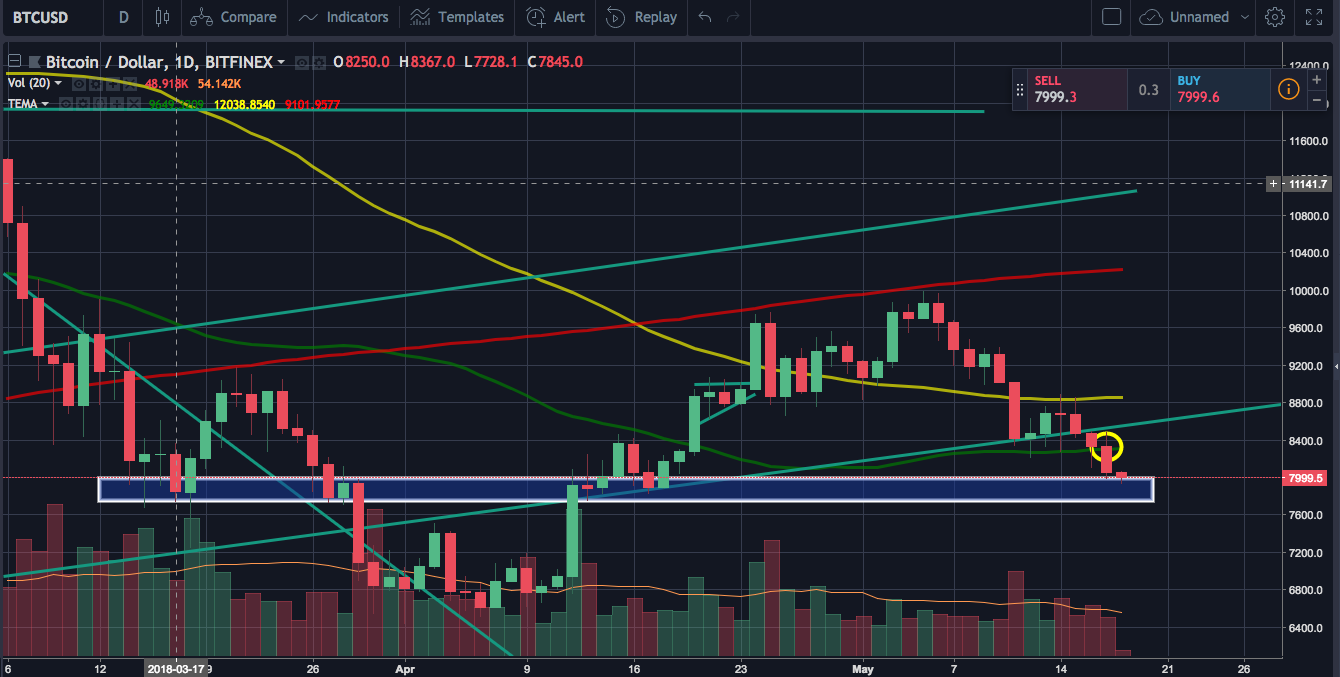
BTC/USD broke down the 50 moving average (yellow circle) and the price is currently holding ~ $8,000 USD/BTC.

Current support line
As mentioned in the previous post, the next support line (range) is ~$7,800 - $8,000 USD/BTC. I don't think it's going down below this support without fundamentally bad news but RSI still has some room to go so we can't be too optimistic.
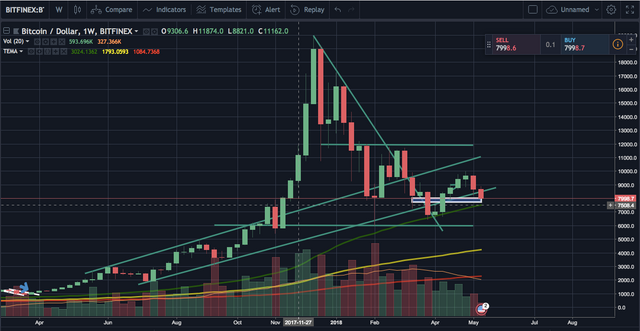
50 week moving average as next support
If the support range doesn't work then the next strong support would be the 50 week moving average, which is currently ~7,500 USD/BTC. The 50 week moving average worked well as a support line at the previous price bottom (~ $6,500 USD/BTC) as you can see in the chart below.

Please upvote and follow me if you enjoyed reading the post.
Where I trade : Binance
Follow me on Twitter : Twitter
Disclaimer : I am not a certified financial advisor. This post is just my personal opinion and not financial advice. Please do your own research and do not trade just based on my posts.